




S&P 500 Remains Strong as Bitcoin Slides to a 1-Year Low

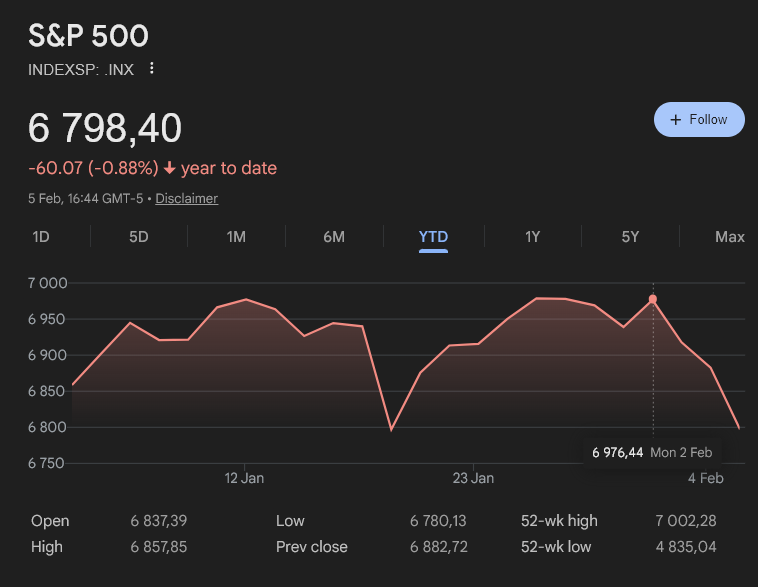
US equities rebounded as the S&P 500 climbed to $6,976, before correcting. Earlier in the week, the benchmark index closed just shy of its prior record before briefly moving higher in subsequent trading, while risk appetite in equities contrasted sharply with continued weakness across crypto markets.
At the same time, Bitcoin continued to underperform, with selling pressure accelerating as broader capital flows favored traditional risk assets. The divergence has become more pronounced in recent sessions, reinforcing the growing split between equity and crypto sentiment.
AI Stocks and Small Caps Drive Equity Momentum
The latest leg higher in the S&P 500 was led by large-cap technology and semiconductor stocks, as investors rotated back into AI-linked names after a brief pause driven by valuation concerns.
Alphabet rose to a new record, Amazon advanced ahead of earnings, and chipmakers posted broad-based gains as demand expectations firmed.
Beneath the surface, market breadth also improved. Small-cap stocks outpaced megacaps, with the Russell 2000 gaining around 3% year-to-date.
That relative strength is often interpreted as a signal of confidence in domestic growth and has added support to broader stock market predictions that point to continued upside as long as earnings momentum holds.
Earnings, Not Valuations, Now Anchor the Rally
Corporate results remain the central driver of the market’s advance. Analysts now expect S&P 500 companies to deliver close to 11% earnings growth for the December quarter, up sharply from estimates earlier in January.
More than 80% of reporting firms have exceeded expectations so far, according to FactSet data cited by market strategists.
Recent research suggests earnings growth has accounted for roughly 84% of total S&P 500 returns in the current cycle, marking a shift away from multiple expansion as the primary engine of gains. This transition has softened concerns around an AI-driven bubble, as profits and cash flow increasingly justify higher prices.
Macro Backdrop Keeps Risk Appetite Intact
The broader macro environment has so far supported equity risk-taking. US GDP growth remains near 3.3%, inflation trends are relatively contained, and productivity indicators have improved. Even political disruptions, including a federal government shutdown that delayed key data releases, failed to dent market confidence materially.
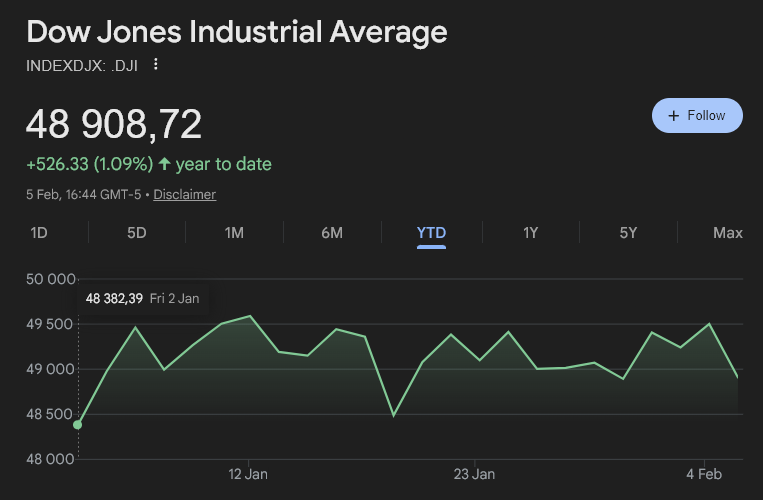
Major US indices posted solid gains alongside the S&P 500, with the Dow Jones Industrial Average rising more than 1% YTD. But the Nasdaq Composite dropped roughly 2.6%.
Investors now look ahead to upcoming economic data and the Federal Reserve’s next policy signals for confirmation that financial conditions will remain supportive.
Bitcoin Weakness Highlights Cross-Market Divergence
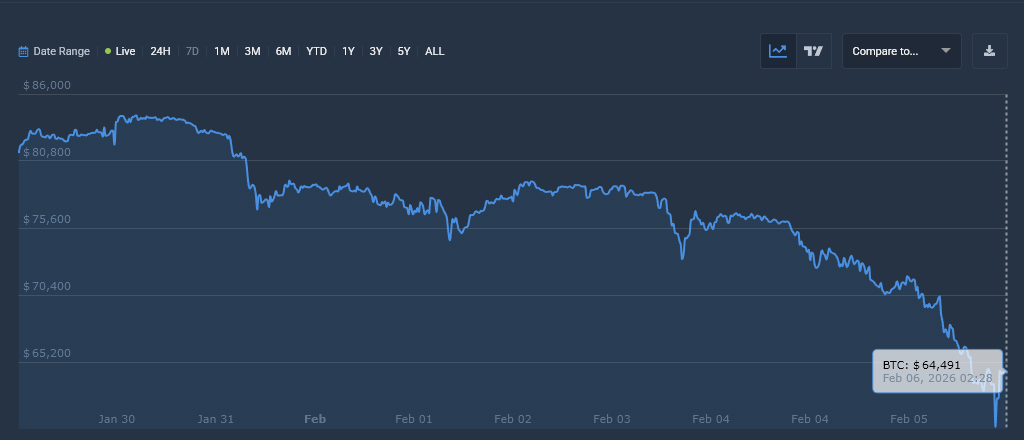
While equities pushed higher, crypto markets moved in the opposite direction. Bitcoin price dropped below $65,000, marking its lowest level in roughly a year and extending a broader downtrend that has weighed on digital assets.
The decline has come amid fading momentum, reduced speculative appetite, and capital rotation toward equities offering visible earnings growth.
The contrasting performance reflects a growing divergence between traditional risk assets and crypto, at least in the near term.
While both markets can benefit from liquidity-driven rallies, current conditions favor assets tied more directly to corporate profits.
Outlook
The S&P 500’s move to new highs reflects a rally increasingly grounded in earnings delivery rather than expanding valuations. AI investment, small-cap strength, and resilient macro data continue to support the upside case, even as record levels invite selective caution.
Bitcoin’s slide to a one-year low highlights where risk appetite is thinning, but for now, equity markets remain firmly in control of the broader risk narrative.
Disclaimer: The content presented above, whether from a third party or not, is considered as general advice only. CFD trading involves significant risk of loss. Past performance does not guarantee future results. This article serves informational purposes only and does not constitute financial advice. Consider your risk tolerance before trading.


