




NZD/USD Price Forecast: Bulls eye 0.6000 after SMA break
- NZD/USD clears 100- and 200-day SMAs, exposing 0.5900.
- RSI momentum turns bullish, but overbought risks may emerge.
- Break above 0.5900 targets 0.5995, 0.6000 and 0.6077.
The Kiwi Dollar extends its three-day rally, climbing above 0.5850 and is poised to challenge 0.5900 amid improving risk appetite and broad US Dollar weakness. The clearance of the 200-day Simple Moving Average (SMA) supports the bullish trend, as traders eye the May monthly high at 0.5995.
NZD/USD Price Forecast: Technical outlook
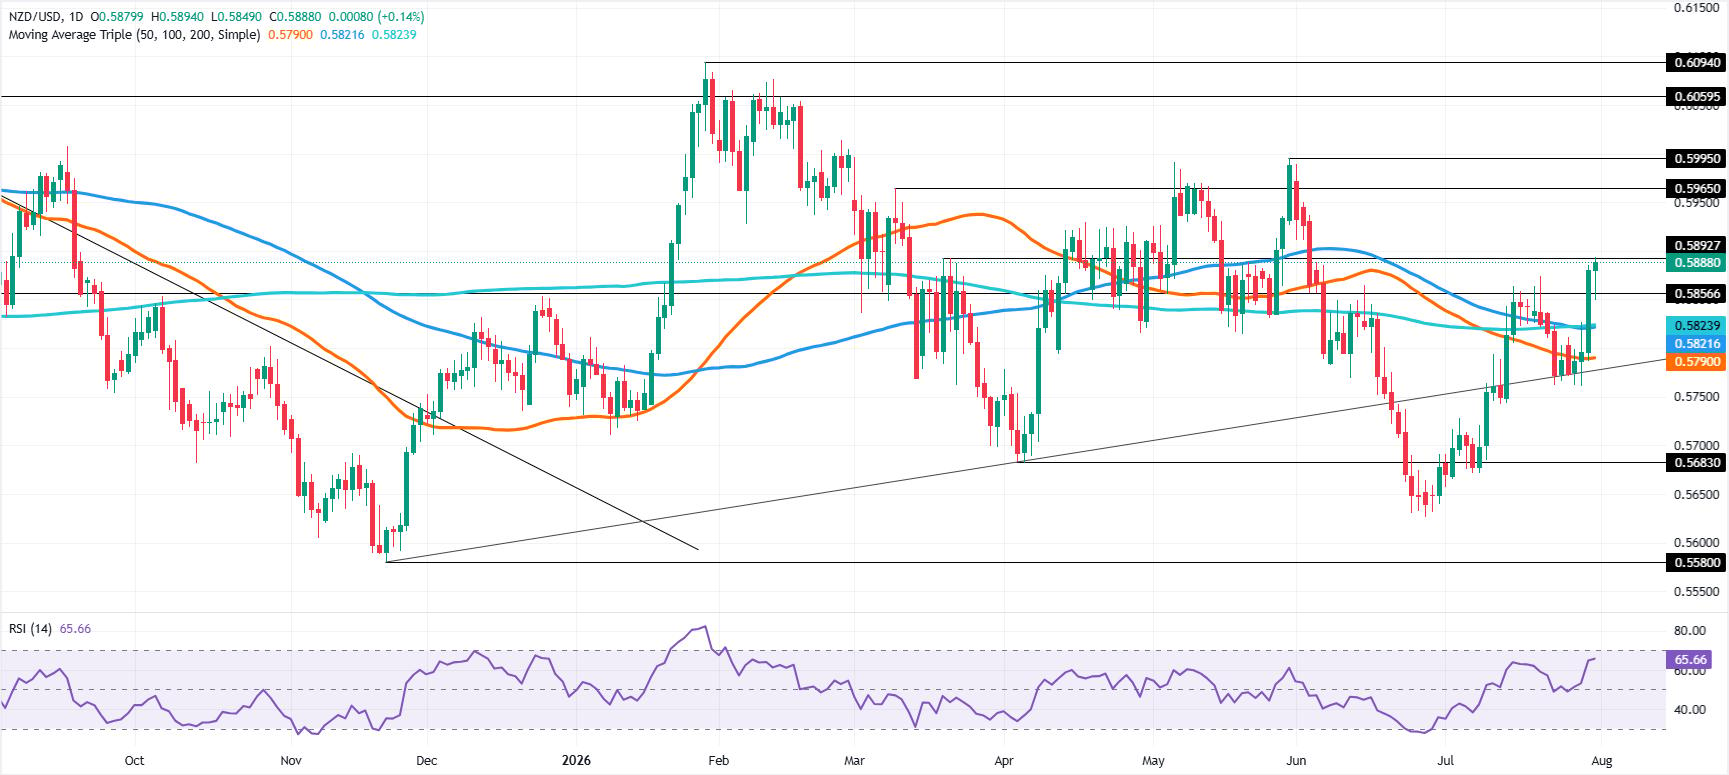
The daily chart shows that market structure is becoming more constructive, indicating further upside in the NZD/USD pair. After surpassing the confluence of the 100- and 200-day Simple Moving Averages (SMAs) at around 0.5821/23, the pair is poised to hurdle the 0.5900 figure.
Momentum has clearly shifted bullish. The Relative Strength Index (RSI) is bullish and aiming towards the overbought territory. Should be remembered that the 80 reading is more precise, delineating extreme overextended uptrends.
If NZD/USD clears 0.5900, the next stop is the May 29 high at 0.5995. Above is 0.6000 followed by the February 12 daily peak at 0.6077, before testing the yearly peak at 0.6094.
Downwards, the first support is the psychological level of 0.5850. Below is the confluence of the 100- and 200-day SMAs, at around 0.5821/23, ahead of 0.5800. Below is the 50-day SMA at 0.5790.
NZD/USD Price Chart – Daily
New Zealand Dollar FAQs
The New Zealand Dollar (NZD), also known as the Kiwi, is a well-known traded currency among investors. Its value is broadly determined by the health of the New Zealand economy and the country’s central bank policy. Still, there are some unique particularities that also can make NZD move. The performance of the Chinese economy tends to move the Kiwi because China is New Zealand’s biggest trading partner. Bad news for the Chinese economy likely means less New Zealand exports to the country, hitting the economy and thus its currency. Another factor moving NZD is dairy prices as the dairy industry is New Zealand’s main export. High dairy prices boost export income, contributing positively to the economy and thus to the NZD.
The Reserve Bank of New Zealand (RBNZ) aims to achieve and maintain an inflation rate between 1% and 3% over the medium term, with a focus to keep it near the 2% mid-point. To this end, the bank sets an appropriate level of interest rates. When inflation is too high, the RBNZ will increase interest rates to cool the economy, but the move will also make bond yields higher, increasing investors’ appeal to invest in the country and thus boosting NZD. On the contrary, lower interest rates tend to weaken NZD. The so-called rate differential, or how rates in New Zealand are or are expected to be compared to the ones set by the US Federal Reserve, can also play a key role in moving the NZD/USD pair.
Macroeconomic data releases in New Zealand are key to assess the state of the economy and can impact the New Zealand Dollar’s (NZD) valuation. A strong economy, based on high economic growth, low unemployment and high confidence is good for NZD. High economic growth attracts foreign investment and may encourage the Reserve Bank of New Zealand to increase interest rates, if this economic strength comes together with elevated inflation. Conversely, if economic data is weak, NZD is likely to depreciate.
The New Zealand Dollar (NZD) tends to strengthen during risk-on periods, or when investors perceive that broader market risks are low and are optimistic about growth. This tends to lead to a more favorable outlook for commodities and so-called ‘commodity currencies’ such as the Kiwi. Conversely, NZD tends to weaken at times of market turbulence or economic uncertainty as investors tend to sell higher-risk assets and flee to the more-stable safe havens.
Recommended Articles


