




S&P 500 Earnings Season 2026: What the Next Seven Days Mean for Australian Traders
The S&P 500 (^GSPC) is up 9.3% in the first half of 2026. Q2 earnings season kicked off on July 14 with the major US banks and the results were strong across the board. Now the season is entering its most consequential week, with Microsoft, Meta, Apple, and Amazon all reporting between July 29 and July 30.
For Australian traders, this is not just a US story. The S&P 500's overnight moves set the tone for the ASX 200 open every single morning. When JPMorgan beats by a wide margin at 7am AEST, Australian equities, AUD/USD, and commodities all reprice before the local session even opens. Understanding what is happening in this earnings season, what the numbers actually mean, and where the risks sit is as important for an Australian CFD trader as it is for anyone on Wall Street.
This guide covers the numbers behind the 24.7% earnings growth rate, what the banks and energy sector have already revealed, and how traders are positioning around the remaining big tech prints.
What the 24.7% Growth Rate Actually Means
The blended year-over-year earnings growth rate for the S&P 500 sits at 24.7% as of July 17, 2026, according to FactSet, marking the second consecutive quarter above 20% and the seventh consecutive quarter of double-digit earnings growth for the index.
The number that makes this quarter genuinely unusual is not the 24.7% itself. It is the fact that analysts revised earnings estimates upward by 3.4% during Q2 2026, against a typical historical pattern of estimates falling by 2% to 3% during any given quarter. That upward revision tells you companies were guiding better than expected heading into results, not worse. If the historical beat rate holds and earnings exceed estimates by the average 8.5 percentage points seen over the past four quarters, the actual Q2 growth rate could land between 29% and 31%, the highest corporate profit expansion since the post-pandemic boom of late 2021.
As of July 17, only 10% of S&P 500 companies had reported, with 89% beating estimates, above the 5-year average of 78%. Since then Tesla and Alphabet have both reported on July 22, and both results add critical context to how the market is reading this earnings season right now.
How the Banks Kicked Off the Season
JPMorgan Chase (JPM), Goldman Sachs (GS), Bank of America (BAC), Wells Fargo (WFC), and Citigroup (C) all reported the week of July 14, and the results were strong across the board. The Finance sector is delivering one of its strongest year-over-year earnings growth quarters in recent memory, driven by a capital markets resurgence, elevated trading volumes, and fee income that held up despite deposit repricing dynamics.
The Federal Reserve has kept its target range at 3.50% to 3.75% through Q2 2026, a stable rate environment that supported net interest income for banks even as some sequential pressure built from deposit competition. The Finance sector's strong start set a confident tone heading into the tech-heavy reporting week beginning July 29.
“Trade US Stocks with an ASIC-regulated broker. Fast AUD funding via PayID. ”
The Energy Sector Surprise
The single most dramatic earnings revision story of Q2 2026 is not in technology. It is in energy.
Energy sector earnings went from a 48% year-over-year growth estimate on March 31 to 123% year-over-year growth in the most recent FactSet data, the largest upward revision of any S&P 500 sector this quarter. The driver is Brent crude at $94 per barrel. Exxon Mobil (XOM) and Chevron (CVX) are the two names concentrated enough to swing the entire sector's earnings reading, and both report later in the season in an oil price environment significantly above where their Q2 estimates were set three months ago.
What Tesla and Alphabet Told Us About Beat-and-Drop Risk
Both Tesla (TSLA) and Alphabet (GOOG) reported on July 22, 2026. Both results carry direct warnings for Australian traders heading into the Microsoft and Amazon reports this week.
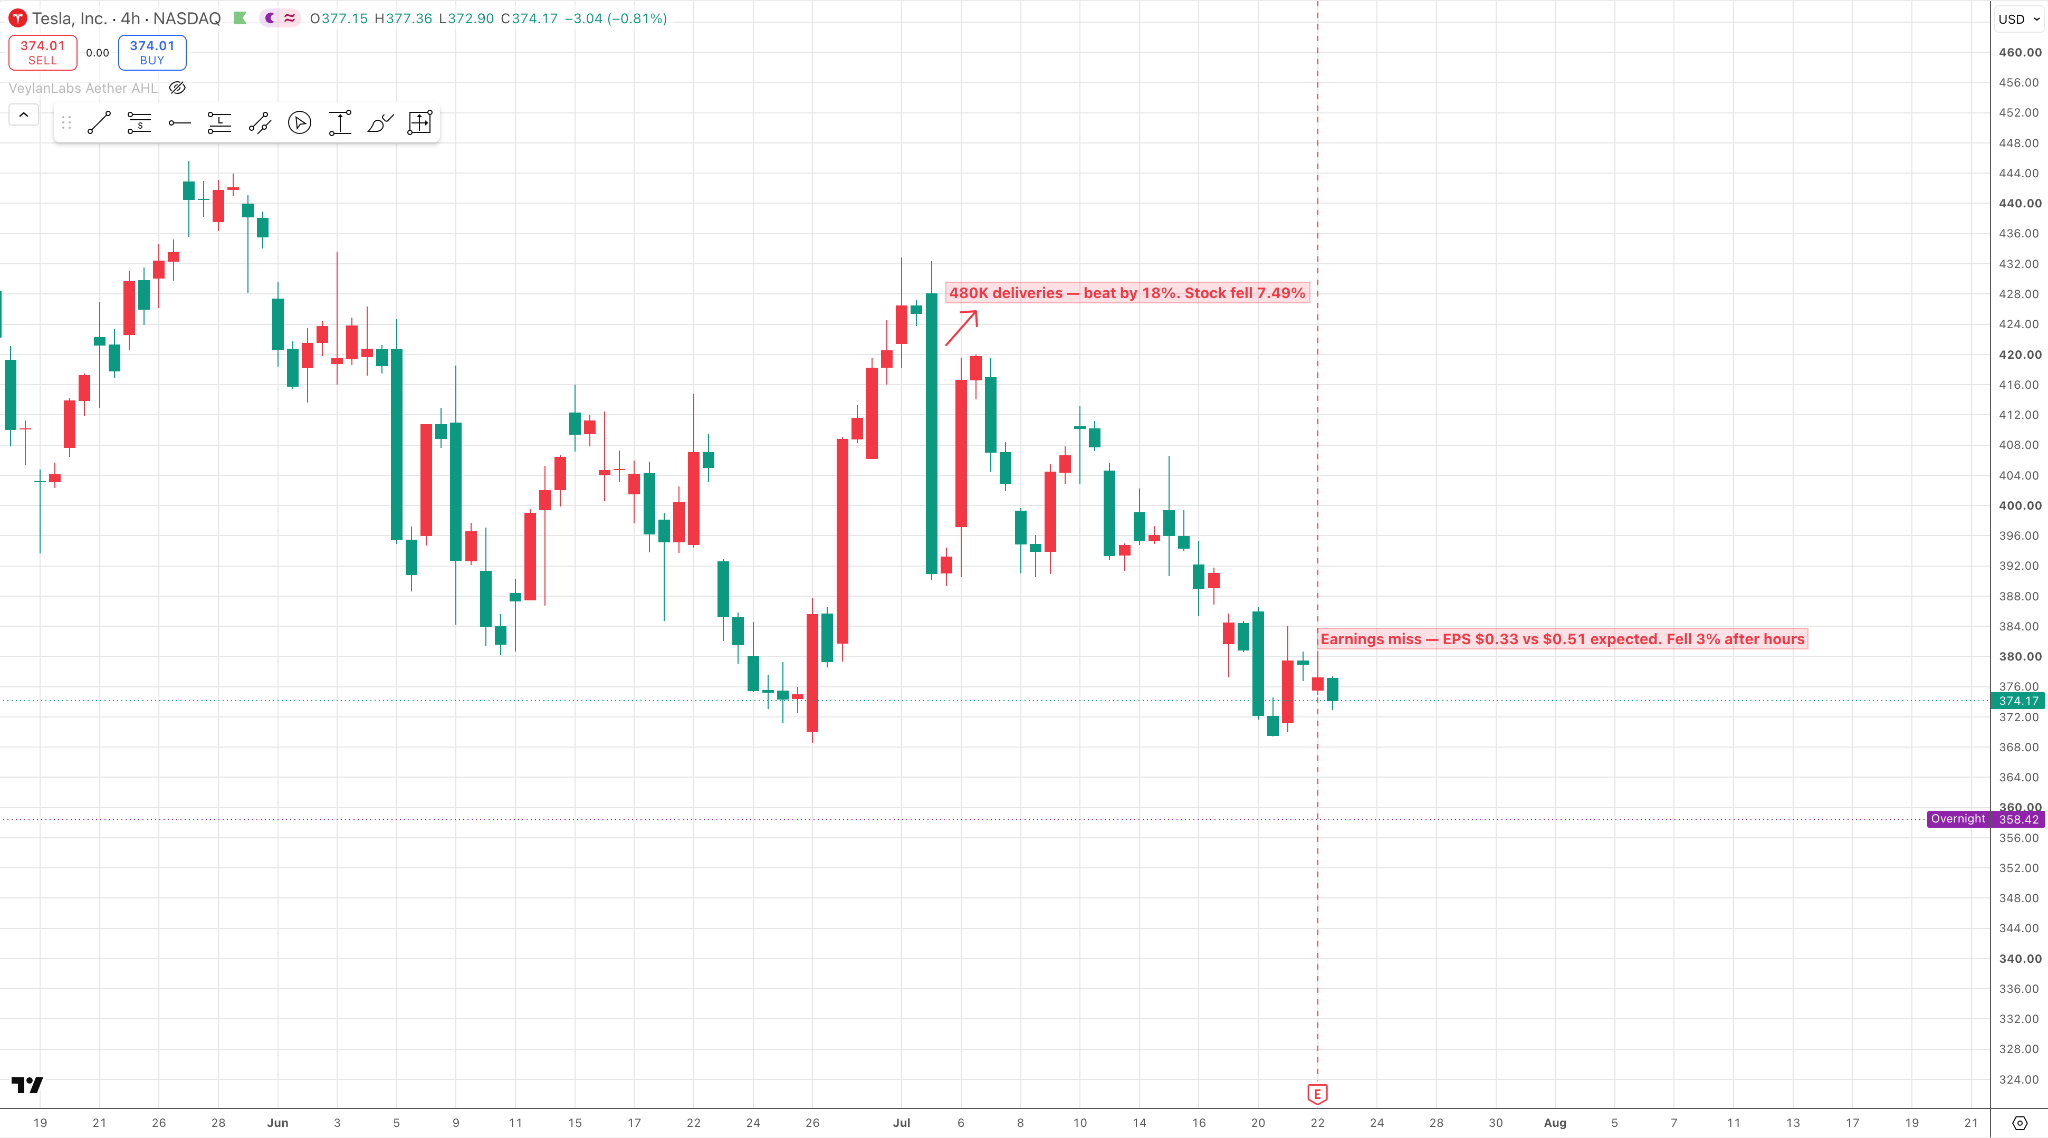
Tesla reported second-quarter revenue of $28.24 billion, up 26% from a year earlier, beating the $25.71 billion estimate. But adjusted EPS came in at $0.33, well below the $0.51 consensus. GAAP operating income dropped 57% year over year to $398 million with operating margin compressing to 1.4%. Free cash flow turned negative at minus $1.09 billion.
Tesla had already delivered 480,126 cars in Q2, beating the delivery estimate of 406,024 by 18%, but the market sold the stock 7.49% on the day that delivery data was released in early July, pricing in fears about margin compression. Those fears proved correct when earnings confirmed the picture on July 22. The stock fell a further 3% in after-hours trading.
Source - TradingView (TSLA)
Alphabet reported second-quarter revenue of $119.8 billion, up 24% year over year, with Google Cloud surging 82% to $24.8 billion. The headline looked clean. The stock sank anyway as management boosted 2026 capex guidance to as high as $205 billion, and adjusted EPS of $2.85 came in just below the $2.89 consensus. The market's message on both results was identical: beating the top line is no longer enough if the cost of achieving that growth is rising faster than the market is comfortable with.
That is the lens through which every Australian trader should read Microsoft and Amazon this week.
“Trade US Stocks with an ASIC-regulated broker. Fast AUD funding via PayID. ”
What Is Coming in the Next Seven Days
This is the week that determines whether the 24.7% blended growth rate moves toward 29% or stalls on guidance disappointment.
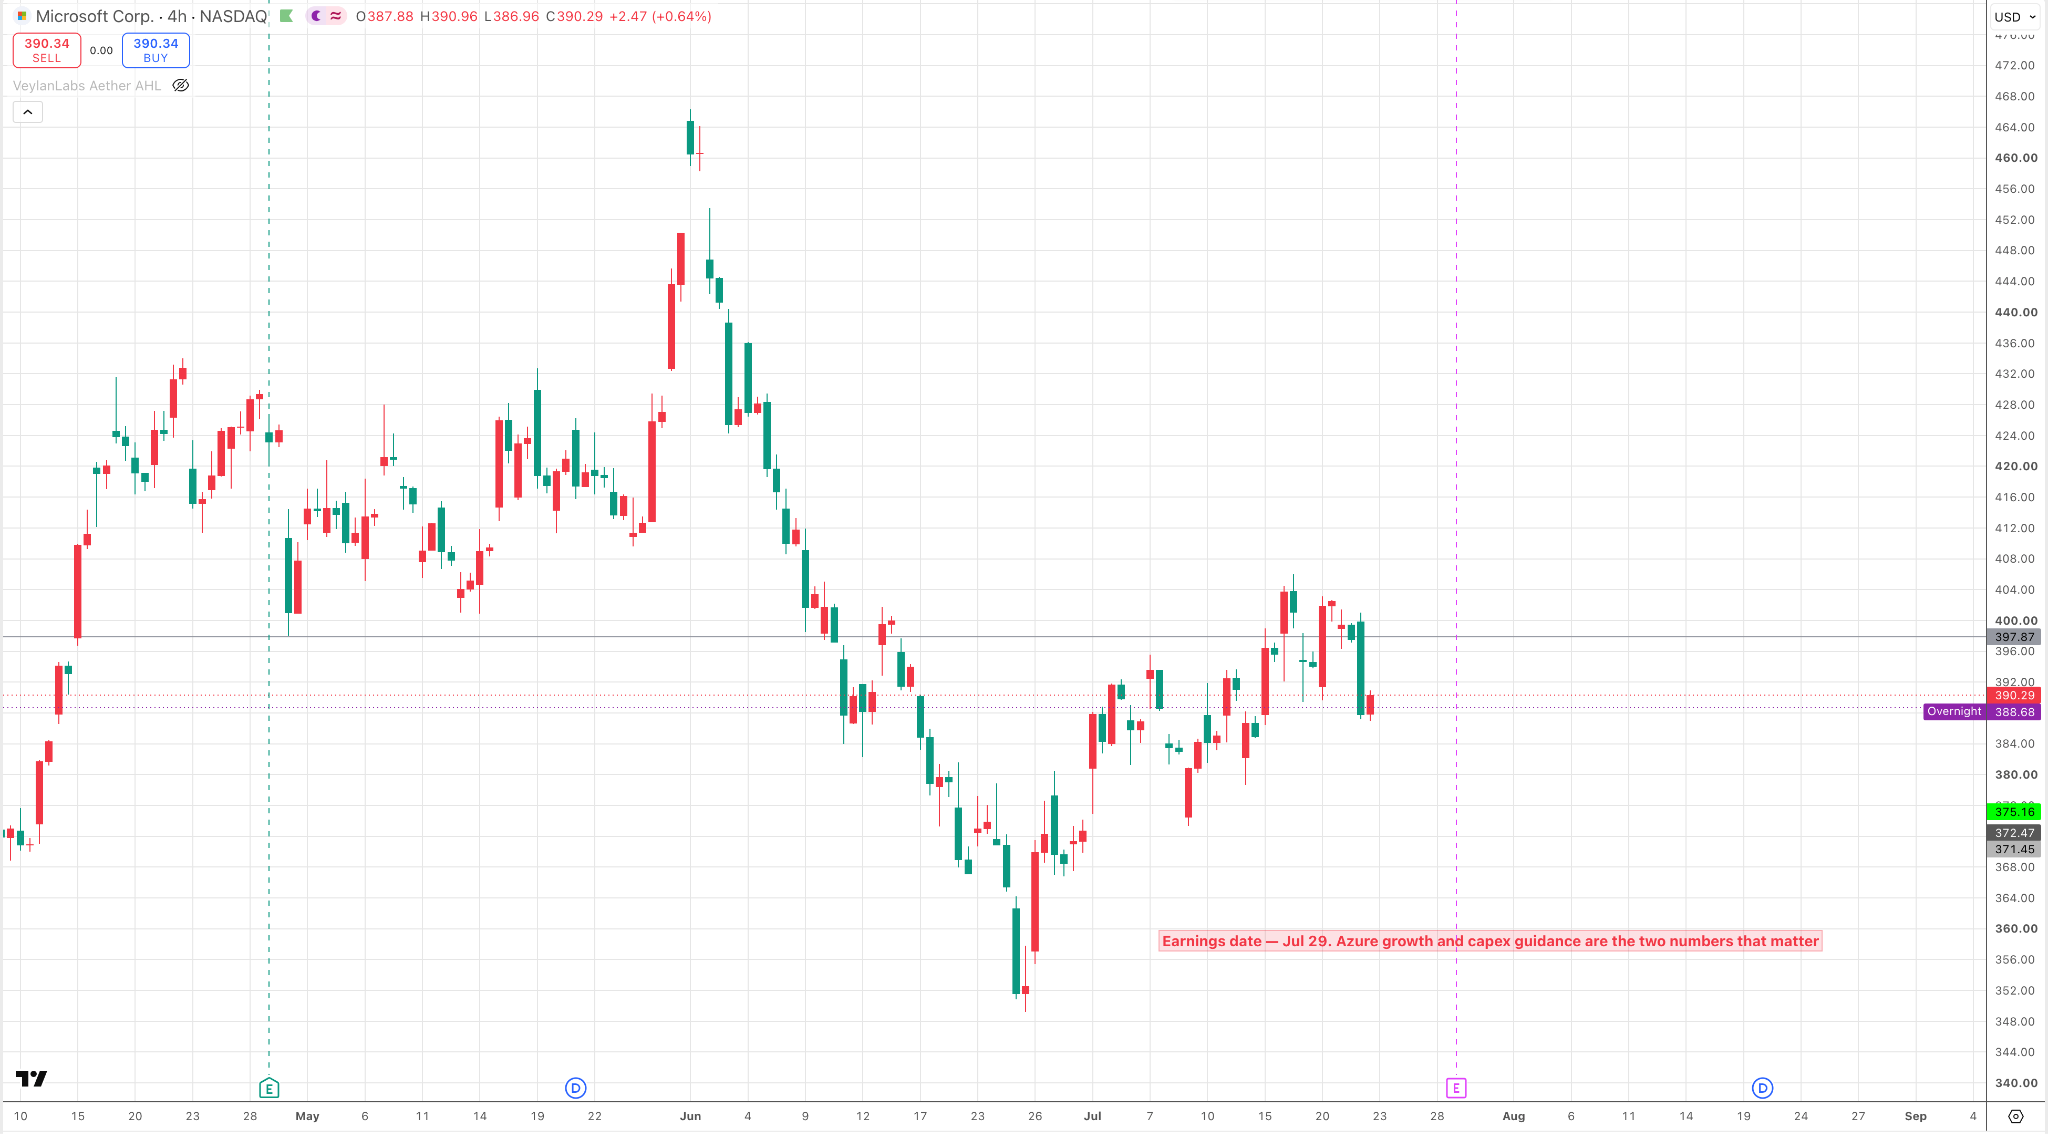
Microsoft (MSFT) and Meta (META) report July 29. Analysts are watching Azure cloud revenue closely for Microsoft, with AI infrastructure spending by hyperscalers now representing the single most important forward indicator in the entire technology sector.
Source - TradingView (MSFT)
Meta's advertising revenue and AI-driven engagement metrics will determine whether the communication services sector's strong performance extends further into the second half.
Apple (AAPL) and Amazon (AMZN) report July 30. Apple's fiscal Q3 report will show whether the iPhone supercycle thesis is playing out and whether services revenue is growing fast enough to offset hardware maturation. Amazon's AWS cloud segment and advertising business are the two metrics that will move the stock and, through it, the Nasdaq and every ASX tech-adjacent name that correlates with overnight US tech moves.
The Alphabet result means Microsoft now faces a higher bar than it would have if Google Cloud had simply beaten cleanly and the stock had rallied. Investors know the market will punish even a revenue beat if cost guidance comes in above what was expected. Microsoft's Azure growth and its 2027 capex commentary are the two numbers that matter most on July 29.
Nvidia (NVDA) reports in late August as the final major earnings event of the season and the one that carries the most weight for the AI infrastructure thesis underpinning the entire 2026 bull case.
How S&P 500 Earnings Flow Into Australian Markets
Every major S&P 500 earnings release after 4pm Eastern Time is 6am to 8am AEST the following morning. Australian traders see the results and the after-hours stock moves before the ASX 200 opens.
The Tesla and Alphabet results landed after midnight AEST on July 23. Australian traders who understood those results before the ASX opened had a clear read on how to position the morning session before the local market had a chance to reprice.
When a major tech company beats and rallies after hours, ASX tech-adjacent names like NextDC (NXT.AX) and Goodman Group (GMG.AX) typically open higher. When a beat is followed by a selloff on guidance disappointment, the ASX 200 open weakens and AUD/USD dips as risk sentiment fades. The seven days ahead are the same opportunity, repeated four more times across Microsoft, Meta, Apple, and Amazon.
How Australian Traders Are Positioning on Mitrade
Mitrade, regulated by ASIC under licence AFSL 398528, offers the S&P 500 as an index CFD alongside individual US stock CFDs including Microsoft (MSFT), Apple (AAPL), Alphabet (GOOG), Nvidia (NVDA), Exxon Mobil (XOM), and Chevron (CVX), all from a single zero-commission account. Traders positioning around earnings reports go long before a result they expect to beat cleanly, or short into a result where the market has priced in too much good news and guidance risk is elevated.
Position sizing matters as much as direction during earnings week. A CFD trader who is right on direction but sized too large can still take a meaningful loss on a violent intraday reversal. Mitrade's trailing stop tool locks in gains as a position moves in your favour, which is particularly useful during high-volatility earnings sessions where a single headline can move a stock 7% to 10% within minutes of the release. A free demo account with $50,000 in virtual funds lets traders practise positioning around earnings events before committing real capital.


1. What is the S&P 500 earnings growth rate for Q2 2026?
The blended year-over-year earnings growth rate for the S&P 500 stands at 24.7% as of July 17, 2026, according to FactSet, marking the second consecutive quarter of earnings growth above 20% for the index. If historical beat rates hold and earnings exceed estimates by the average margin seen over the past four quarters, the actual Q2 growth rate could reach 29% to 31%, the highest corporate profit expansion since the post-pandemic boom of late 2021.
2. Why does S&P 500 earnings season matter for Australian traders?
S&P 500 earnings results are released after US market close at 4pm Eastern Time, which is 6am to 8am AEST. Australian traders see the overnight results and after-hours stock moves before the ASX opens every morning during earnings season. Major results from companies like Microsoft, Apple, and Amazon directly affect the ASX 200 open, AUD/USD direction, and commodity-linked instruments before the local session begins.
3. What happened with Tesla and Alphabet earnings on July 22?
Tesla reported adjusted EPS of $0.33 against a $0.51 consensus estimate, with free cash flow turning negative at minus $1.09 billion and operating income dropping 57% year over year despite revenue beating at $28.24 billion. Alphabet beat revenue at $119.8 billion but delivered adjusted EPS of $2.85 versus the $2.89 consensus and boosted 2026 capex to as high as $205 billion. Both stocks fell after hours. The market is no longer rewarding revenue beats when the cost of achieving them is rising faster than expected.
4. Which S&P 500 companies report in the next seven days?
Microsoft and Meta report July 29. Apple and Amazon report July 30. These four companies collectively represent trillions in market capitalisation and their forward guidance on AI spending and margins will determine whether the blended growth rate moves toward 29% to 31% or stalls on cost concerns. Nvidia reports in late August as the final major event of the season.
5. What is the beat-and-drop pattern and why does it matter this week?
The beat-and-drop pattern occurs when a company reports results above analyst estimates and the stock falls because the market had already priced in the beat or is concerned about cost guidance. Tesla and Alphabet both demonstrated this on July 22. Australian traders watching Microsoft and Amazon this week should understand that a revenue beat alone does not guarantee a stock moves higher after hours.
6. Can Australian traders access S&P 500 earnings plays on Mitrade?
Yes. Mitrade offers the S&P 500 as an index CFD alongside individual US stock CFDs including Microsoft (MSFT), Apple (AAPL), Alphabet (GOOG), Nvidia (NVDA), Exxon Mobil (XOM), and Chevron (CVX) under ASIC regulation with licence AFSL 398528. Traders can go long or short on all instruments with zero commission and a free demo account with $50,000 in virtual funds is available before going live.
Disclaimer: The content presented above, whether from a third party or not, is considered as general advice only. CFD trading involves significant risk of loss. Past performance does not guarantee future results. This article serves informational purposes only and does not constitute financial advice. Consider your risk tolerance before trading.


