


The Stock Market Sounds an Alarm for the First Time in Nearly 27 Years. Here Is What History Says the S&P 500 Will Do Next.
Key Points
The S&P 500 Shiller CAPE ratio measures 10 years' worth of earnings trends.
Rising CAPE ratios have historically preceded market corrections.
While lower returns should be expected, it's important to remain invested through periods of weakness.
- 10 stocks we like better than S&P 500 Index ›
The S&P 500 (SNPINDEX: ^GSPC) has gained 12% so far in 2026, extending a bull market fueled mostly by enthusiasm around artificial intelligence (AI). However, the rally has not been without some turbulence. Both the S&P 500 and Nasdaq Composite (NASDAQINDEX: ^IXIC) recently witnessed sharp declines as investors grapple with sticky inflation, elevated bond yields, and concerns about how the AI revolution is being financed.
There's another reason investors should be cautious. The CAPE ratio and Buffett indicator suggest the stock market is historically expensive. In fact, the CAPE ratio has climbed above 40, a level previously sustained only during the dot-com bubble.
Missed AI’s "Act 1"? Act 2 Could Be 15x Bigger. Most investors think they missed the AI boat because they didn't buy Nvidia in 2005. But according to our analysts, we’re only at the end of "Act 1"—the R&D phase. "Act 2" is the global rollout. Continue »
Does this mean the stock market is about to crash? Read on to find out.
The CAPE ratio has approached dot-com territory
The cyclically adjusted price-to-earnings (CAPE) ratio was popularized by economist Robert Shiller. A conventional price-to-earnings (P/E) ratio compares stock prices with earnings over a single year. By contrast, the CAPE ratio divides the S&P 500's price by the average of 10 years of inflation-adjusted earnings. By taking a longer-term view, CAPE readings smooth out fluctuations in profits affected by recessions or unusual booms.
Currently, the CAPE ratio hovers around 41, more than double its historical average of 17.8. Over 155 years worth of stock market data, the only other sustained period when the CAPE ratio exceeded 40 was during the dot-com bubble. It peaked around 44 in December 1999, shortly before technology stocks imploded.
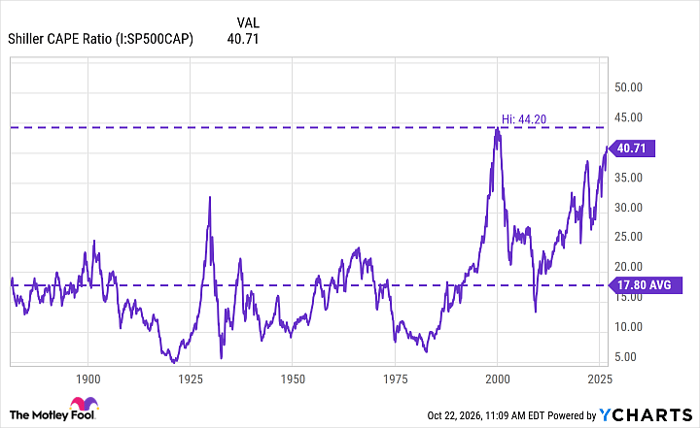
Shiller CAPE Ratio data by YCharts
The Buffett indicator is flashing red
Another popular valuation metric is the Buffett indicator, aptly named after legendary investor Warren Buffett. The calculation is straightforward: Divide the total market capitalization of U.S. stocks by the country's annual gross domestic product (GDP). Currently, the Buffett indicator sits around 237%. This means the stock market is valued at $2.37 for every $1 of annual U.S. economic output.
While that might suggest stocks are egregiously overvalued, there are important reasons today's market differs from the dot-com era. For starters, many of today's largest companies are incredibly profitable. Microsoft, Alphabet, Amazon, and Nvidia generate substantial revenue and cash flow. By contrast, many speculative internet companies that commanded astronomical valuations in the late 1990s never even generated sales, let alone turned a profit.
In addition, the Buffett indicator has a unique limitation. Many companies in the S&P 500 operate globally. This means that any business activity they generate overseas can contribute to their valuation, but generally won't be included in the U.S. GDP. As a result, comparing stock market capitalization exclusively with domestic economic output can exaggerate how expensive stocks appear.

Image source: Getty Images.
Is the stock market going to crash?
The CAPE ratio and Buffett indicator are sending an important warning: When these metrics rise, history suggests that future stock market returns will be weaker than investors have grown accustomed to. With that said, neither metric tells us exactly when the next correction will arrive. For that reason, selling everything now just because stocks look expensive will mean missing out on additional gains in the long run.
To me, the current environment presents an opportunity to reassess portfolio risk. Investors with outsize exposure to AI stocks or speculative technology companies may want to consider trimming these positions and diversifying into more established businesses.
I'd prioritize blue chip stocks with capable management teams, durable competitive advantages, diversified business models, and strong balance sheets. Companies that consistently generate cash flow and return capital through dividends or share repurchases also provide an attractive foundation for investors with a long-term time horizon.
Ultimately, neither the CAPE ratio nor the Buffett indicator proves that a stock market crash is imminent. It's just that both tools suggest investors should temper their expectations as the market becomes increasingly frothy. Rather than trying to predict the next crash, I'd focus on owning resilient businesses capable of creating shareholder value through whatever economic cycle comes next.
Should you buy stock in S&P 500 Index right now?
Before you buy stock in S&P 500 Index, consider this:
The Motley Fool Stock Advisor analyst team just identified what they believe are the 10 best stocks for investors to buy now… and S&P 500 Index wasn’t one of them. The 10 stocks that made the cut could produce monster returns in the coming years.
Consider when Netflix made this list on December 17, 2004... if you invested $1,000 at the time of our recommendation, you’d have $350,756!* Or when Nvidia made this list on April 15, 2005... if you invested $1,000 at the time of our recommendation, you’d have $1,363,905!*
Now, it’s worth noting Stock Advisor’s total average return is 922% — a market-crushing outperformance compared to 213% for the S&P 500. Don't miss the latest top 10 list, available with Stock Advisor, and join an investing community built by individual investors for individual investors.
See the 10 stocks »
*Stock Advisor returns as of October 22, 2026.
Adam Spatacco has positions in Alphabet, Amazon, Microsoft, and Nvidia. The Motley Fool has positions in and recommends Alphabet, Amazon, Microsoft, and Nvidia. The Motley Fool has a disclosure policy.
Recommended Articles


