Pi Network Price Forecast: PI holds modest gains as mixed technicals curb upside

Source Fxstreet
  • Pi Network is up nearly 2% on Friday, holding above the $0.0744 support level and extending its consolidation range.
  • The Fear and Greed Index at 49 amid rising long liquidations suggests neutral-to-bearish crypto market sentiment.
  • Pi Network’s technical outlook is mixed as the price approaches a long-term resistance trendline at $0.0823.

Pi Network (PI) price is up 2% on Friday, showing signs of recovery while the broader cryptocurrency market faces near-term weakness. The crypto market sentiment eases to neutral from bullish amid rising long liquidations. Pi Network's price must surpass the overhead trendline near $0.0823 to sustain an upward trend.

Crypto market loses bullish traction

The broader cryptocurrency market shows signs of easing investors’ risk appetite. The Fear and Greed Index slips to 49 on Friday, down from 69 on October 1, indicating that bullish sentiment is easing toward neutral levels. 

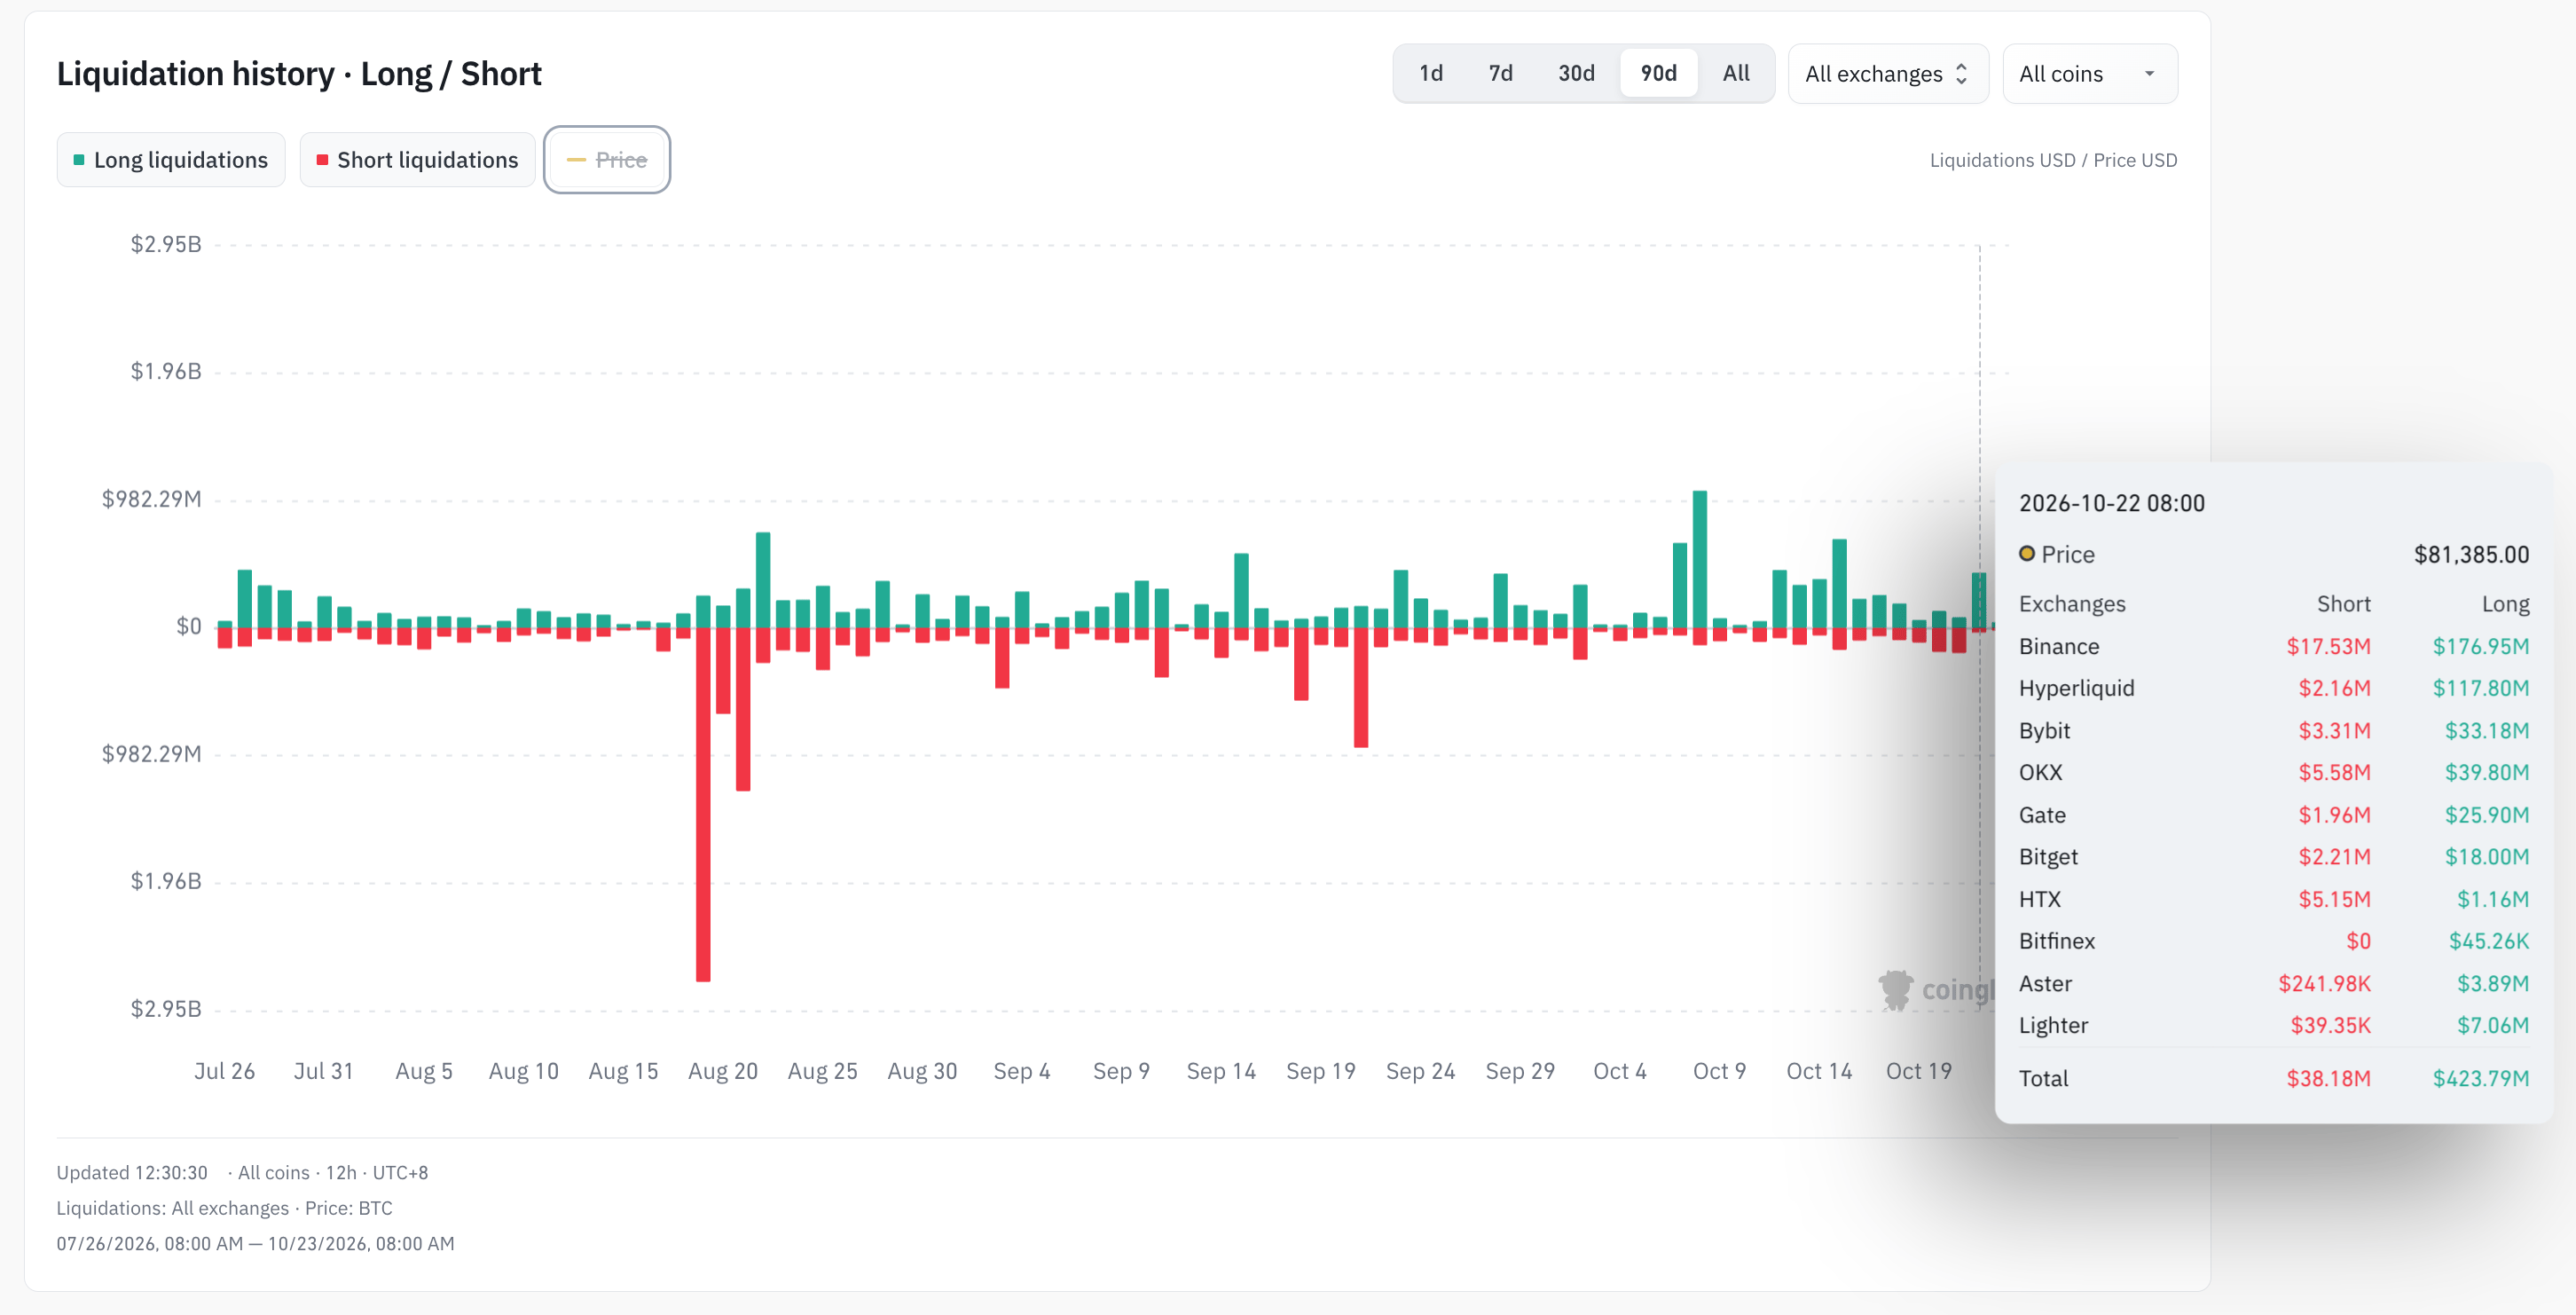
On the other hand, CoinGlass data shows $423 million in long liquidation on Thursday, compared to $38.18 million in short liquidation, suggesting sell-side dominance. Taken together, the buy-side weakness aligns with the heightened unwinding of long positions. 
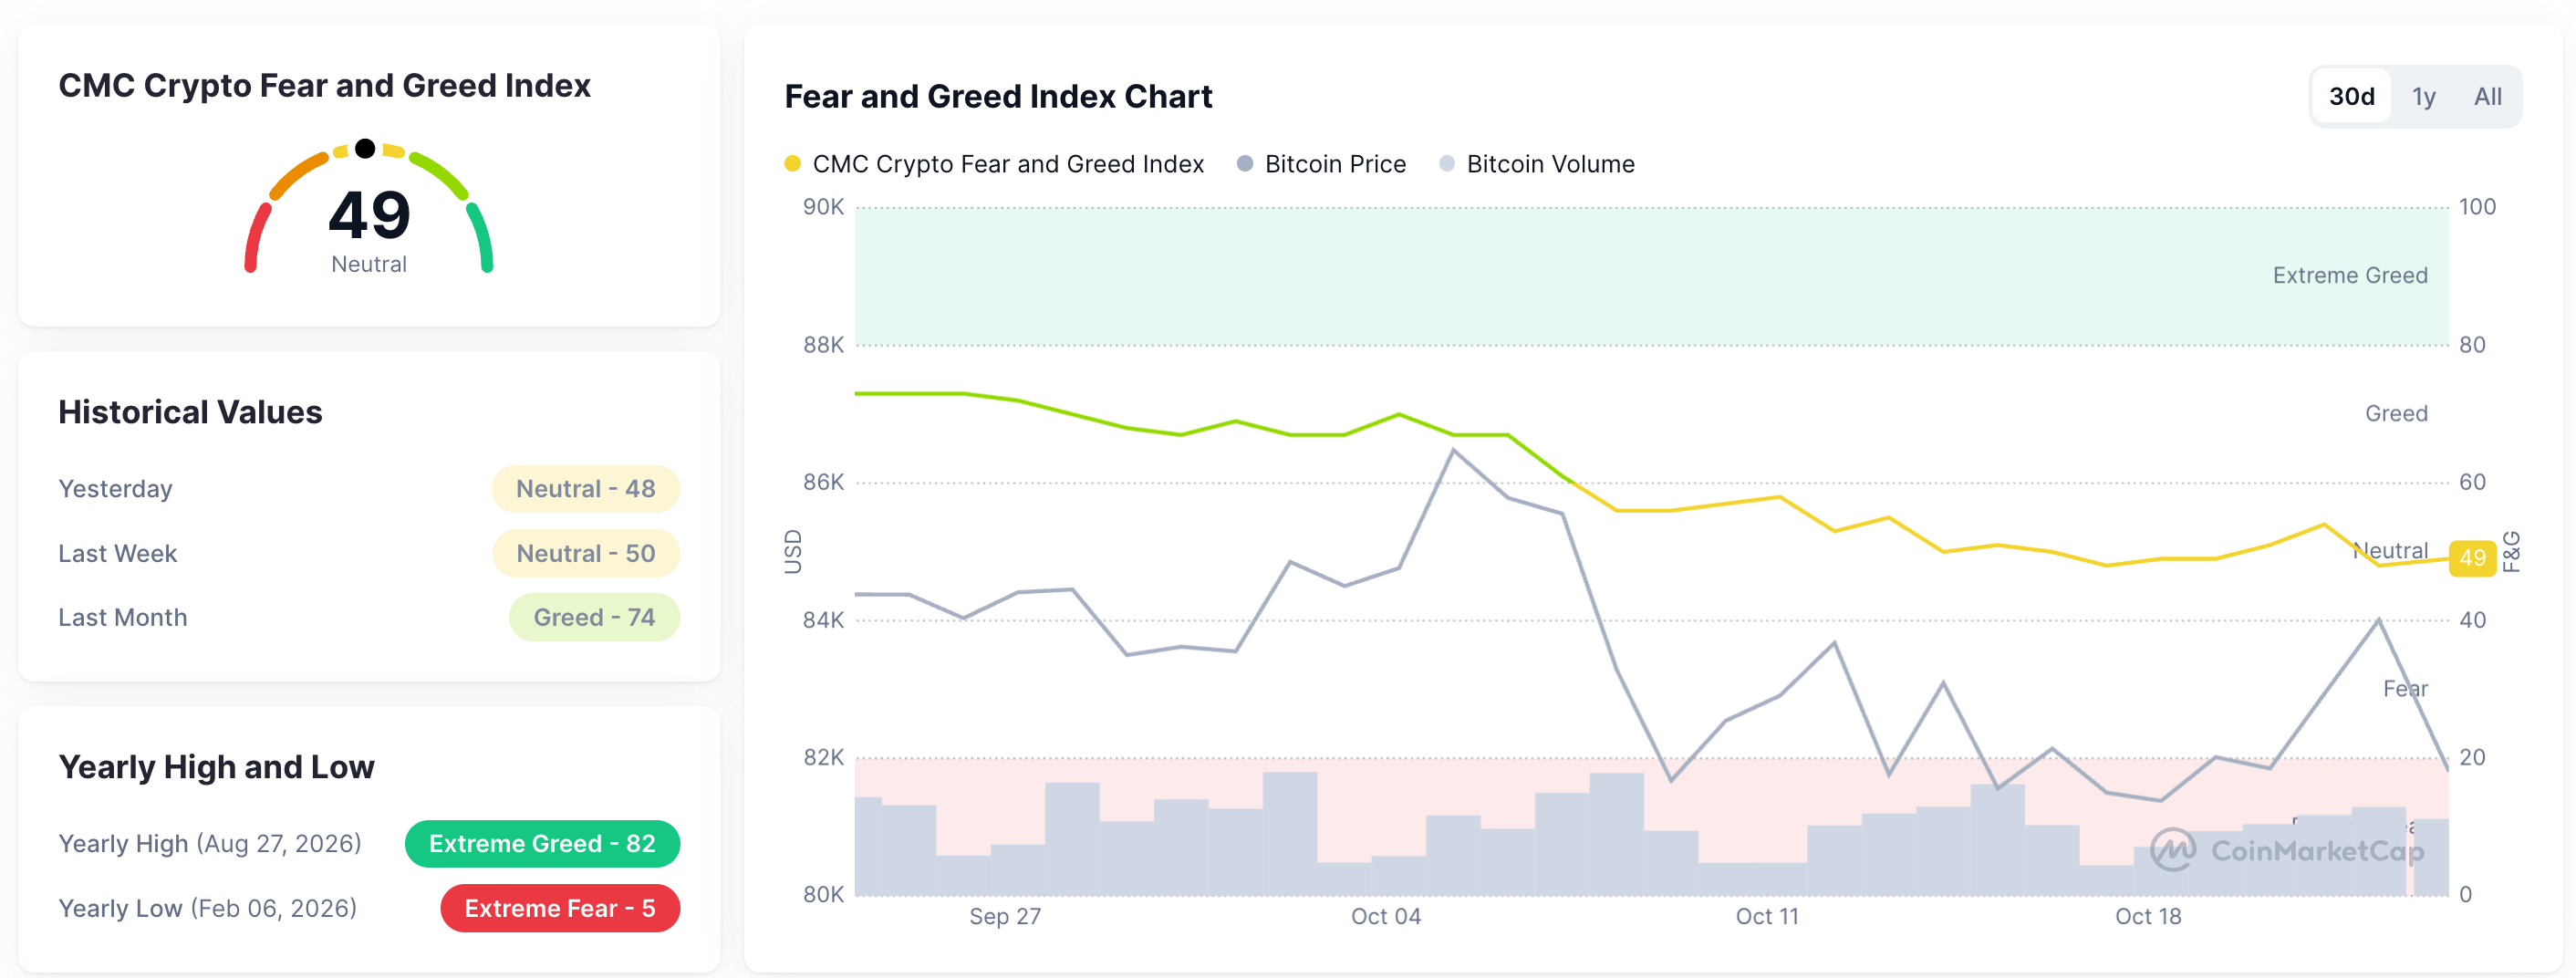
Fear and Greed Index. Source: CoinMarketCap
Crypto liquidation data. Source: CoinGlass

Technical outlook: Will Pi Network regain a bullish trend?

Pi Network trades at $0.0800 at press time on Friday, showing another bullish rebound attempt from the $0.0774 support level. The PI token maintains a bearish near-term bias as the price remains capped below the declining resistance trendline, connecting the June 20 and August 22 highs around $0.0823.

In addition, the price sits below the 50-period Exponential Moving Average (EMA) at $0.0855 and the 200-period EMA near $0.1228, reinforcing a capped tone. A confirmed breakout above the trendline at $0.0823 could extend the rally toward the 50-period EMA at $0.0855, which is reinforced by the 23.6% Fibonacci retracement at $0.0866, measured from $0.1394 to $0.0704.

Momentum gains mild upward traction on the daily chart, with Moving Average Convergence Divergence (MACD) marginally rising above its signal line, while the Relative Strength Index (RSI) is around 43, hinting at stabilization rather than a decisive recovery.

PI/USD daily price chart.

On the downside, the next meaningful support is at the October 8 low of $0.0774, followed by the Fibonacci cycle low around $0.0704, where buyers could attempt to build a more durable base if the current slide continues.

(The technical analysis of this story was written with the help of an AI tool. Know more.)

Disclaimer: For information purposes only. Past performance is not indicative of future results.
placeholder
XRP Price Prediction for July 2026: Can Buyers Finally Break the Downtrend?XRP (XRP) price trades near $1.05, caught between a year-long downtrend and a sudden burst of buying.July has historically rewarded XRP holders. This year the month arrives with on-chain accumulation
Author  Beincrypto
Jun 30, Tue
XRP (XRP) price trades near $1.05, caught between a year-long downtrend and a sudden burst of buying.July has historically rewarded XRP holders. This year the month arrives with on-chain accumulation
placeholder
XAUUSD Gold Analysis: Gold Holds Above $4,350 Ahead of US Inflation Data Is $4,500 Next? Gold holds above $4,350 following weak US jobs data. As inflation reports approach and UBS eyes $5,000, can XAUUSD break resistance at $4,435 to rally toward $4,500?
Author  Naoufal Seddik
Aug 12, Wed
Gold holds above $4,350 following weak US jobs data. As inflation reports approach and UBS eyes $5,000, can XAUUSD break resistance at $4,435 to rally toward $4,500?
placeholder
Gold Price Analysis Today: Gold Drops 1.32% Despite Lower Fed Rate-Hike Bets, Can $4,313 Support Hold? Gold fell 1.32% on August 13 after rising to $4,449.73, then reversing lower and closing near $4,349.918 below the $4,356.46 support. Softer US inflation data reduced Fed rate hike expectations, but selling pressure still dominated the session. Will $4,313 support hold?
Author  Naoufal Seddik
Aug 14, Fri
Gold fell 1.32% on August 13 after rising to $4,449.73, then reversing lower and closing near $4,349.918 below the $4,356.46 support. Softer US inflation data reduced Fed rate hike expectations, but selling pressure still dominated the session. Will $4,313 support hold?
placeholder
Gold Price Analysis Today: Gold Gains 0.94% as Markets Expect Fed to Hold Rates, Can $4,449 Resistance Break? Gold gained 0.94% on August 17, closing near $4,417.30 as softer US data strengthened expectations for unchanged Fed rates in September. Gold remains bullish, with $4,449.730 resistance and $4,310.650 support in focus.
Author  Naoufal Seddik
Aug 18, Tue
Gold gained 0.94% on August 17, closing near $4,417.30 as softer US data strengthened expectations for unchanged Fed rates in September. Gold remains bullish, with $4,449.730 resistance and $4,310.650 support in focus.
placeholder
3 Stocks That Can Benefit From SpaceX’s Surprise Q3 EarningsSpaceX’s latest earnings have given Wall Street a reason to revisit AI hardware stocks. Elon Musk’s company is preparing to spend billions more on computing infrastructure, and three US-listed stocks
Author  Beincrypto
Oct 21, Wed
SpaceX’s latest earnings have given Wall Street a reason to revisit AI hardware stocks. Elon Musk’s company is preparing to spend billions more on computing infrastructure, and three US-listed stocks
goTop
quote