

Berkshire Stock Nears Record High as AI Selloff Drives Defensive Rotation, Just 1.6% From Peak

Source Tradingkey

TradingKey - On October 19 Eastern Time, Warren Buffett's Berkshire Hathaway (BRK.A)(BRK.B) continued its recent strong momentum. As of the close on October 16, Berkshire's share price was only about 1.6% below its all-time high. Based on closing prices from October 2 to 16, its Class A shares rose about 5.8%, while the Nasdaq Composite Index fell about 3.9% over the same period.

In terms of stock price catalysts, market sentiment may be the main driving factor. Last week, AI chip and infrastructure-related stocks experienced a sell-off as investors worried about rising financing costs and whether massive investments could yield sufficient revenue. Meanwhile, Berkshire's business spans multiple sectors, including insurance, energy, railroads, manufacturing, and consumer products; as a result, the strength of the company's fundamentals may attract increased attention.

According to financial data disclosed by Berkshire, as of the end of June 2026, cash, cash equivalents, and short-term U.S. Treasury bills held by its insurance and other businesses, net of unsettled purchases, totaled approximately $359.2 billion. Second-quarter operating profit on a company-defined basis was $12.983 billion, up from $11.160 billion in the same period last year; the company also repurchased approximately $4.5 billion of its stock during the quarter.

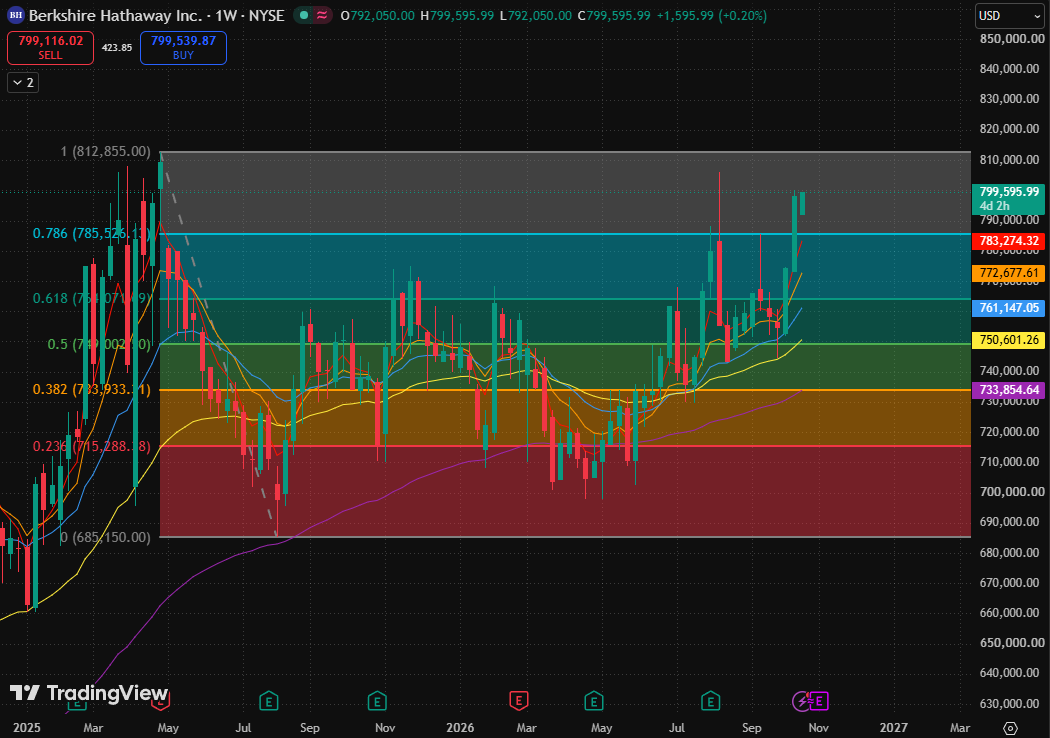
Looking at the weekly chart of BRK.A, the current stock price has climbed above the 0.786 Fibonacci retracement level ($785,526) and is approaching its previous high of $812,855. This represents a strong continuation within a long-term uptrend, currently testing resistance near the previous high.
3-a09bce787d3a472d8eb61000d2d365f5

Berkshire Hathaway Class A shares weekly chart, Source: TradingView

Regarding moving averages, the 5-day, 10-day, 20-day, 80-day, and 160-day exponential moving averages show a bullish alignment and are sloping upward in tandem. The stock price maintains a distinct distance above the moving averages, pointing to a strong medium-term trend. Given that the stock price has entered the resistance zone of its previous high, the current focus should be on observing whether a valid breakout and successful retest with support occur near the previous high.

The biggest downside risk is encountering resistance near the previous high, causing the price to fall back below $785,526 and forming a false breakout below the previous peak. Because the stock price has strayed significantly from its medium- to long-term exponential moving averages, if the breakout fails, the magnitude of the pullback could be larger than that of ordinary consolidation.

Disclaimer: For information purposes only. Past performance is not indicative of future results.
placeholder
Smart Money is Leaving Nvidia for This AI Chip StockNvidia stock price keeps sliding, yet the usual dip buyers are missing. Institutional money flow on the stock is the most negative of any major chip name, which means big investors are stepping back i
Author  Beincrypto
Jun 30, Tue
Nvidia stock price keeps sliding, yet the usual dip buyers are missing. Institutional money flow on the stock is the most negative of any major chip name, which means big investors are stepping back i
placeholder
NVIDIA Price Forecast: Michael Burry Shorts NVDA, but Analysts See $299On July 1, NVIDIA (NASDAQ: NVDA) sits at $198.34, failing to break above the former support level that is now serving as resistance between $198 and $205 on the 2H chart's downward blue c
Author  TradingKey
Jul 02, Thu
On July 1, NVIDIA (NASDAQ: NVDA) sits at $198.34, failing to break above the former support level that is now serving as resistance between $198 and $205 on the 2H chart's downward blue c
placeholder
XAUUSD Gold Analysis: Gold Holds Above $4,350 Ahead of US Inflation Data Is $4,500 Next? Gold holds above $4,350 following weak US jobs data. As inflation reports approach and UBS eyes $5,000, can XAUUSD break resistance at $4,435 to rally toward $4,500?
Author  Naoufal Seddik
Aug 12, Wed
Gold holds above $4,350 following weak US jobs data. As inflation reports approach and UBS eyes $5,000, can XAUUSD break resistance at $4,435 to rally toward $4,500?
placeholder
Gold Price Analysis Today: Gold Drops 1.32% Despite Lower Fed Rate-Hike Bets, Can $4,313 Support Hold? Gold fell 1.32% on August 13 after rising to $4,449.73, then reversing lower and closing near $4,349.918 below the $4,356.46 support. Softer US inflation data reduced Fed rate hike expectations, but selling pressure still dominated the session. Will $4,313 support hold?
Author  Naoufal Seddik
Aug 14, Fri
Gold fell 1.32% on August 13 after rising to $4,449.73, then reversing lower and closing near $4,349.918 below the $4,356.46 support. Softer US inflation data reduced Fed rate hike expectations, but selling pressure still dominated the session. Will $4,313 support hold?
placeholder
Gold Price Analysis Today: Gold Gains 0.94% as Markets Expect Fed to Hold Rates, Can $4,449 Resistance Break? Gold gained 0.94% on August 17, closing near $4,417.30 as softer US data strengthened expectations for unchanged Fed rates in September. Gold remains bullish, with $4,449.730 resistance and $4,310.650 support in focus.
Author  Naoufal Seddik
Aug 18, Tue
Gold gained 0.94% on August 17, closing near $4,417.30 as softer US data strengthened expectations for unchanged Fed rates in September. Gold remains bullish, with $4,449.730 resistance and $4,310.650 support in focus.
goTop
quote