


IBM Stock Forecast: Morgan Stanley Lift Puts $238 Breakout in Play Before a Deal-Recovery Test
TradingKey - International Business Machines (NYSE: IBM) went up 2.74% to finish at $234.12 on Thursday, October 15, as Morgan Stanley raised its price target to $238 from $190 and kept its Equal-Weight rating. As a result, IBM is up from recent lows, but still down about 30% from its 52-week high of $332.46 and up about 18% from its July lows of $199.19.
I have one question: Did the deals that IBM missed in its second quarter get delayed or did they get lost? The catalyst has been confirmed. IBM will report Q3 results on Wednesday, October 21, and will hold its call at 5:00 p.m. ET.
Why Q2 Damaged Confidence
Revenue for Q2 increased to $17.16 billion, which was below analyst expectations of about $17.46 billion. Operating EPS was in line with estimates at $2.93. However, several big deals that were expected to close in Q2 slipped in late June as customers shifted their budgets to server, storage, and memory-related products.
Management also lowered its constant-currency revenue growth outlook from more than 5% to between 4% and 5%. Arvind Krishna said the shortfall was due to execution and explained that about a third of the big deals that slipped in Q2 got closed in the first three weeks of Q3.
The Deal-Recovery Debate
What captures my attention is the gap between management’s message and the Street’s read. For example, UBS reiterated its Neutral rating and $236 target on IBM on October 13, saying IBM had recaptured less than half of the slipped deals. The firm’s Q3 revenue estimate is $16.68 billion, which is below the consensus of $16.80 billion.
For me, this is what next Wednesday will test. If most of the remaining deals closed in Q3, the revenue story looks far cleaner. If not, the guidance cut may not be the last.
Software: Strong Core, Uneven Edges
Software revenue was up 5% to $7.8 billion. However, the growth was lopsided. Red Hat and Data grew 11% and 19%, respectively, and Automation was up 4%. On the other hand, Transaction Processing software decreased 8%.
With regard to software annual recurring revenue, it was $24.6 billion, an increase of 8%, and approximately 80% of software revenue is recurring. Large one-time license deals slipping is what ultimately impacted Q2.
Infrastructure: A Tough Mainframe Comparison
Revenue from Infrastructure decreased 7% to $3.8 billion. A 42% drop in IBM Z mainframe revenue was partly offset by 37% growth in distributed infrastructure. According to Krishna, the decline in mainframe sales was due to deal timing, with the z17 cycle still running near 130% of the prior cycle, and therefore the sales decline is more of a timing issue than a decline in demand.
Cash Flow Holds, but the Balance Sheet Is Tighter
In 2026, IBM expects to increase free cash flow by approximately $1 billion and increased the expected operating pretax margin expansion to 100 basis points. First-half free cash flow was flat at $4.8 billion.
The balance sheet is less flexible. Cash and marketable securities decreased by $6.3 billion to $8.2 billion. Total debt was $62.0 billion. The quarterly dividend of $1.69 is covered and yields about 2.9%.
Quantum Adds a Long-Term Story
On October 7, IBM advanced to Stage C of DARPA’s Quantum Benchmarking Initiative. Long term, Quantum computing supports the investment case at about 18 times forward earnings.
IBM Technical Analysis: IBM Reclaims Key Moving Averages as Bulls Eye $238.07 Breakout
As of my 4-hour chart, IBM is currently trading at $234.09, up 0.49% with pre-market quotes showing the stock even slightly higher at $234.82. Price has been trending up since bouncing off the $217.68 level in early October, where it found support by the ascending trendline from the July lows. More recently, price has broken out above the red and blue moving averages, which previously capped upside rallies since mid-September, at $228.60 and $231.89, respectively. Considering the aforementioned, the bulls are in control; however, IBM is still trading within the range it's been in since August between $226.53 and $238.07.
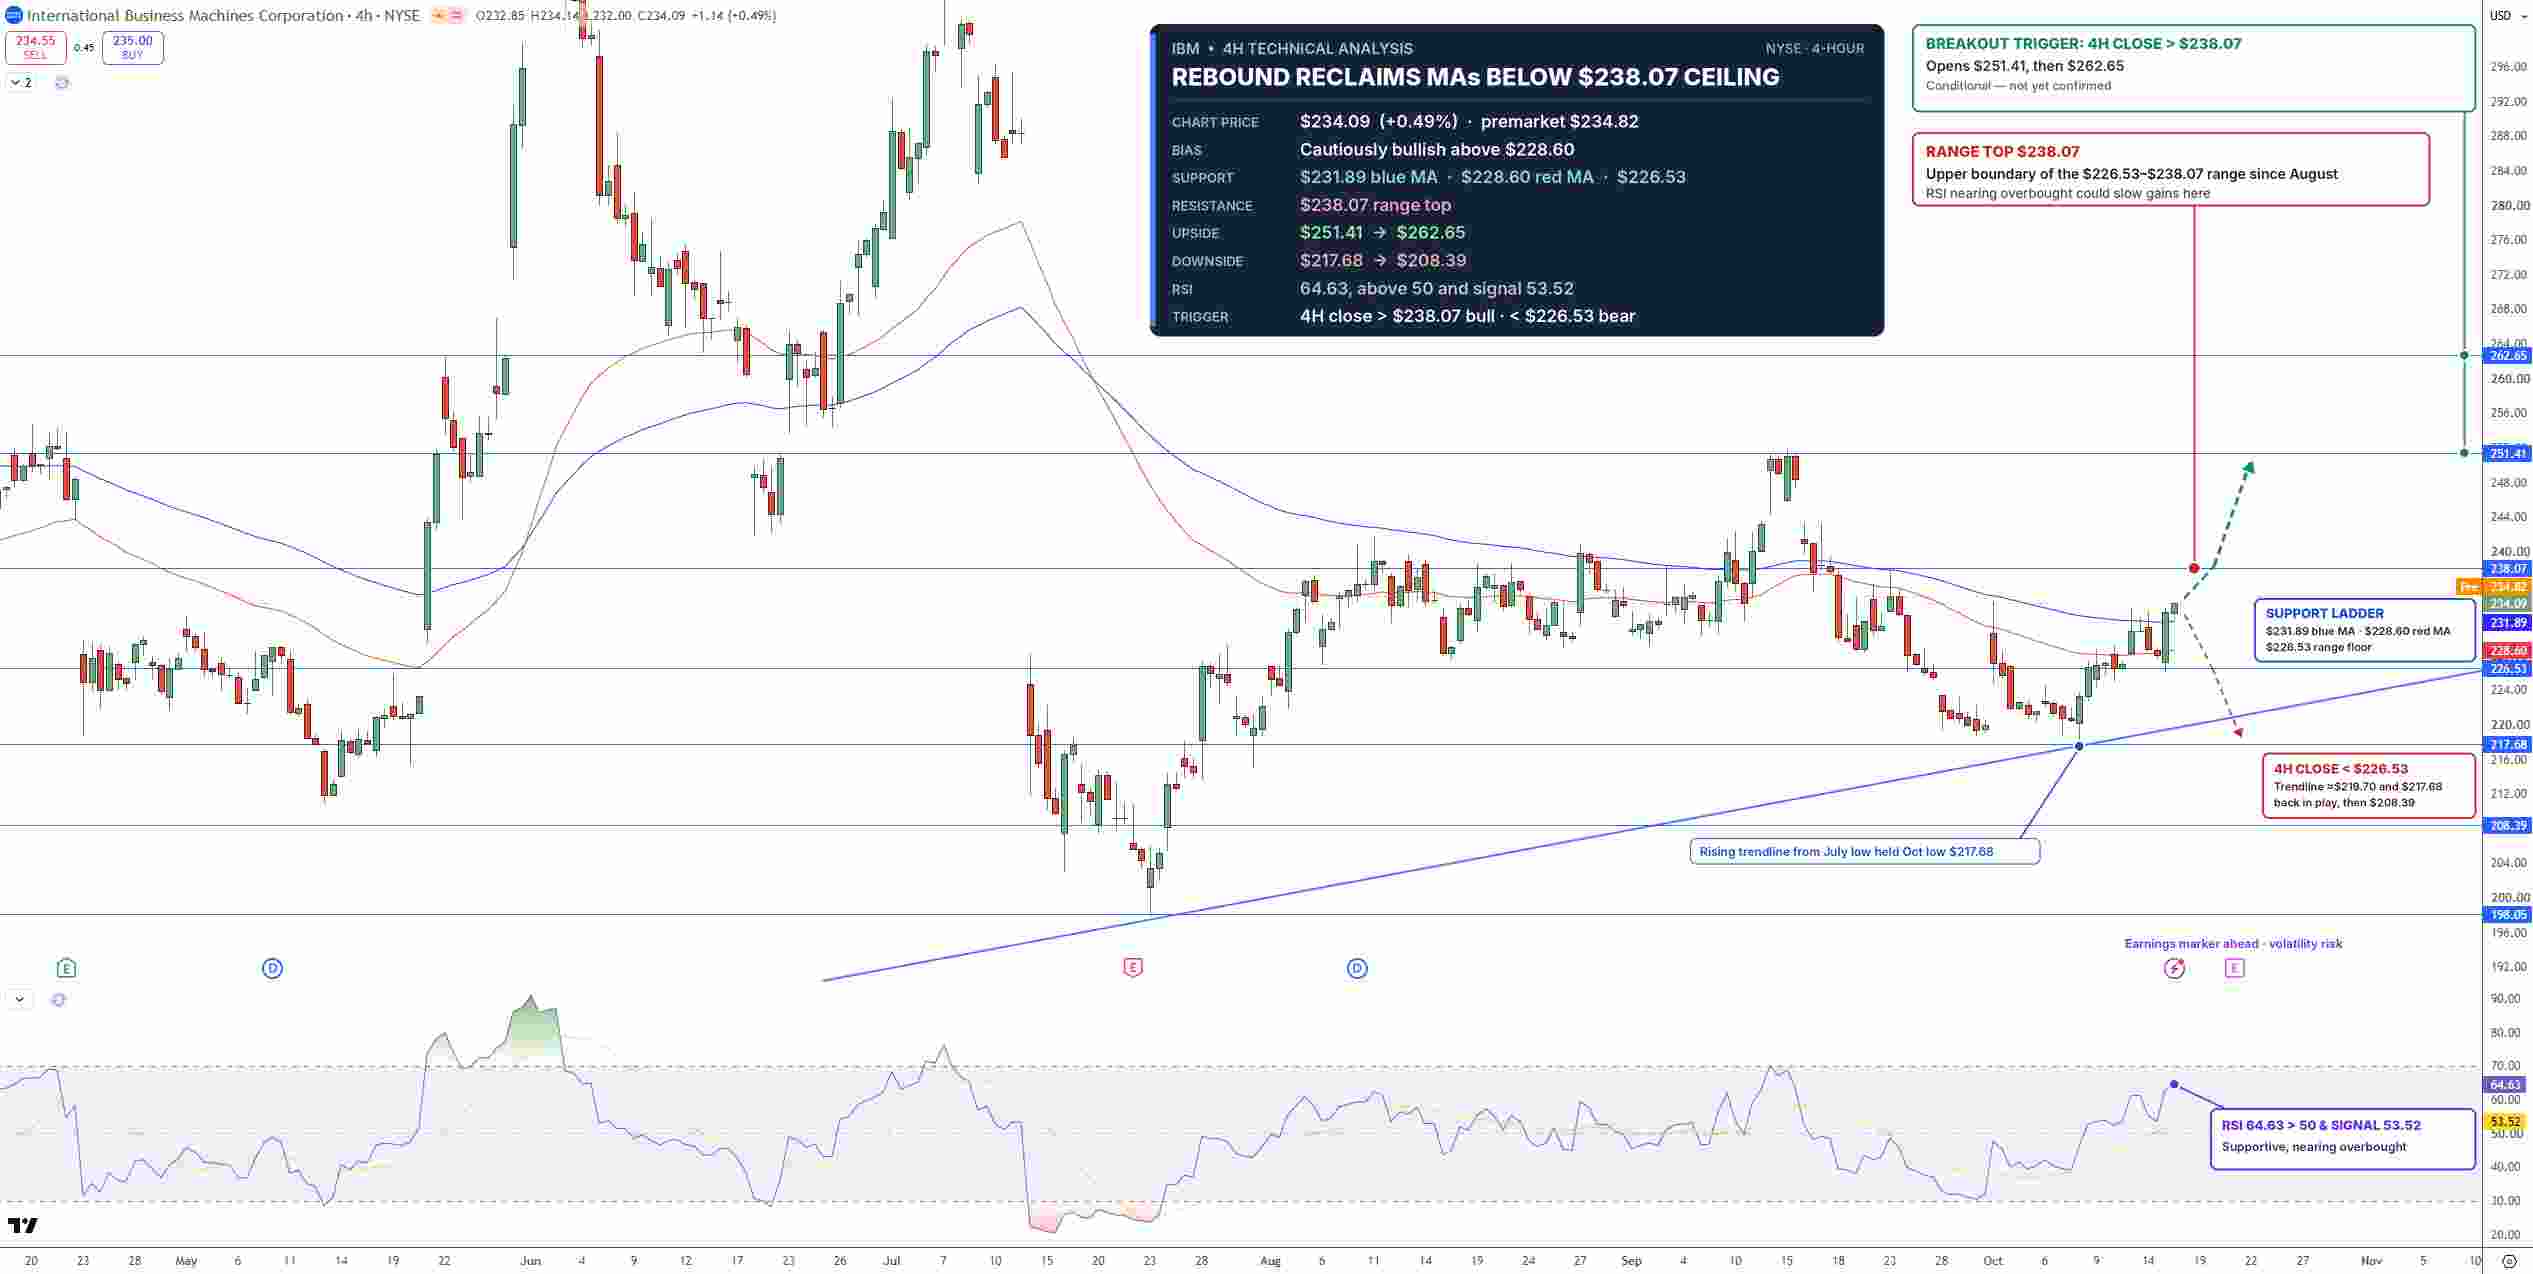
IBM Stock Price Chart - Source: Tradingview
The RSI has also risen to 64.63, and is above its signal line at 53.52. If the RSI continues to rise, it could be indicative of an overbought condition, which may slow down the price action.
While we are not there yet, a 4-hour close above $238.07 would confirm an upside breakout targeting the next level of resistance at $251.41, and then $262.65. If support does not hold at the moving averages at $228.60 and $231.89, then lower support levels can be found at $226.53, $217.68, and $208.39.
I'm bullish on the stock as long as it's above $228.60, but given we're trading at these levels ahead of earnings, I would expect plenty of volatility on Wednesday.
Key Levels
Last Close: $234.12, up 2.74% on October 15
Support: $231.89, $228.60, $226.53, $217.68
Resistance: $238.07, $251.41, $262.65
RSI: 64, above its signal line at 53.52
Bullish Trigger: 4-hour close above $238.07
Bearish Trigger: 4-hour close below $226.53
FAQs
Why did IBM stock rise on October 15?
The stock rose 2.74% on October 15, after Morgan Stanley raised its price target to $238 from $190 while keeping an Equal-Weight rating. This is ahead of Q3 earnings on October 21.
What is the IBM stock forecast before earnings?
Where the short-term bias is cautiously bullish above $228.60. A move above the resistance level at $238.07 would open the way up to $251.41 and $262.65. Alternatively, a close below $226.53 would pave the way down to $217.68.
Bottom Line
The recurring nature of the software business, coupled with the cash flow, should give the stock a base. However, investors will be focusing on the 21st of October to see if the slippage with the Q2 deals was a timing issue. If the conversion of the deals looks strong, the stock could test the upside at $251.41. A close above $238.07 would encourage a bullish view. However, if the stock trades below $226.53, it would invalidate the bullish view.
Recommended Articles


