


Is Citigroup Stock a Buy 13% Below Its 52-Week High?
Key Points
Citigroup just reported Q3 earnings and beat estimates.
It had its best third quarter in a decade.
It is a buy for dividend investors.
- 10 stocks we like better than Citigroup ›
Investors may be looking at a buy-the-dip moment on Citigroup (NYSE: C) stock after the nation's third-largest bank by total assets posted impressive third-quarter earnings. Despite the blowout results, the stock price dipped in the days following the earnings release. Shares have fallen almost 5% since earnings were released on Oct. 13 to $126 per share, and roughly 13% since their 52-week closing high of $145 per share on June 22.
This presents a buying opportunity for investors, as Citigroup appears to be a good deal for certain types of investors.
Missed AI’s "Act 1"? Act 2 Could Be 15x Bigger. Most investors think they missed the AI boat because they didn't buy Nvidia in 2005. But according to our analysts, we’re only at the end of "Act 1"—the R&D phase. "Act 2" is the global rollout. Continue »
Image source: Getty Images.
Best Q3 in a decade
All the major banks reported earnings last week, and Citigroup had the best results outside of more investment banking-focused rivals like Goldman Sachs (NYSE: GS).
Citigroup recorded its highest third-quarter revenue in a decade, at $23.8 billion, up 8% year over year. Net interest income rose 14%, offsetting a 4% decline in non-interest fee revenue. It beat estimates of $23.7 billion.
Net income increased 37% to $5.2 billion in the third quarter 2026, while earnings per share increased 53% to $2.85 per share. EPS beat estimates of $2.65 per share. On an adjusted basis, excluding a goodwill impairment, EPS was $2.24, up 20%. Earnings were buoyed by sound expense management, as expenses rose just 3%, excluding notable items.
Its efficiency ratio improved to 58.5%, from 64.7% in Q3 2025. Further, its return on tangible common equity (ROTCE) improved 350 basis points year over year to 11.5%. The bank expects to finish the year with ROTCE above its target range and north of 11%.
Why Citigroup is a buy
Citigroup stock is mainly a buy for its dividend. It raised its dividend last quarter to $0.67 per share and is paying a yield of 2.18%.
Data by YCharts.
It also has plenty of capital to maintain that dividend, even if the economy heads south. It reported a common equity tier 1 (CET1) ratio of 12.8% in Q2, comfortably ahead of the 11.6% ratio mandated by the Federal Reserve.
That strong capital position allowed Citigroup to return $4.1 billion to shareholders in Q3 through dividends and share buybacks. The bank also has a very low dividend payout ratio of 24%, meaning just 24% of its earnings go toward dividends. That gives it ample leeway to maintain or raise its dividend.
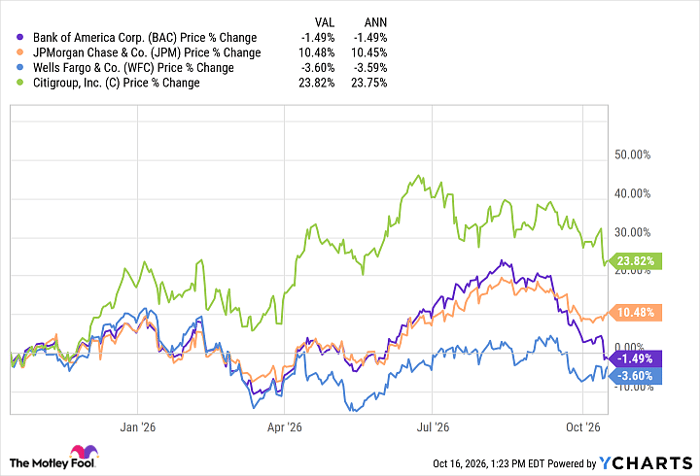
Even with the recent dip, Citigroup stock is up 6% year-to-date and 29% over the past 12 months. The stock is also cheap, trading at 10 times forward earnings. Some 78% of analysts rate it a buy, with a median price target of $154 per share, implying 25% upside.
I'm a little skeptical of that type of upside, given the tenuous state of the economy, but if you are looking for a solid dividend stock that's cheap, Citigroup might be a decent option, certainly among large banks. It is outperforming the big four banks over the past year, yet has a similar dividend yield that looks very sustainable, and it is cheaper than the others on a forward P/E basis.
Should you buy stock in Citigroup right now?
Before you buy stock in Citigroup, consider this:
The Motley Fool Stock Advisor analyst team just identified what they believe are the 10 best stocks for investors to buy now… and Citigroup wasn’t one of them. The 10 stocks that made the cut could produce monster returns in the coming years.
Consider when Netflix made this list on December 17, 2004... if you invested $1,000 at the time of our recommendation, you’d have $380,363!* Or when Nvidia made this list on April 15, 2005... if you invested $1,000 at the time of our recommendation, you’d have $1,315,732!*
Now, it’s worth noting Stock Advisor’s total average return is 919% — a market-crushing outperformance compared to 211% for the S&P 500. Don't miss the latest top 10 list, available with Stock Advisor, and join an investing community built by individual investors for individual investors.
See the 10 stocks »
*Stock Advisor returns as of October 18, 2026.
Citigroup is an advertising partner of Motley Fool Money. Bank of America is an advertising partner of Motley Fool Money. JPMorgan Chase is an advertising partner of Motley Fool Money. Wells Fargo is an advertising partner of Motley Fool Money. Dave Kovaleski has no position in any of the stocks mentioned. The Motley Fool has positions in and recommends Goldman Sachs Group and JPMorgan Chase. The Motley Fool has a disclosure policy.
Recommended Articles


