


SpaceX Stock Price Forecast: Shares Fall Below $160 as Falcon 9 Mission Successfully Completed
TradingKey - In the early morning of October 13 local time, SpaceX (SPCX) launched a Cargo Dragon spacecraft into orbit using a Falcon 9 rocket for NASA's 35th Commercial Resupply Services mission (CRS-35). After lifting off from Cape Canaveral Space Force Station in Florida, the rocket left a large glowing plume in the pre-dawn sky, creating a striking spectacle resembling jellyfish tentacles that many onlookers dubbed a "space jellyfish."
CRS-35 lifted off from Launch Complex 40 at 6:33 a.m. Eastern Time. The Cargo Dragon spacecraft, carrying over 6,300 pounds of scientific research equipment, crew supplies, and space station hardware, is scheduled to autonomously dock with the International Space Station's Harmony module after approximately 52 hours of flight.
One of the most critical payloads for this mission is the final set of roll-out solar arrays for the International Space Station. Once installed, the new arrays will further boost the station's power supply capacity, providing energy support for scientific experiments, daily operations, and future controlled deorbiting. The spacecraft also carries research projects on artificial retinas, microgravity materials, and life sciences.
The Dragon spacecraft performing this mission had previously completed three spaceflights, while the Falcon 9 first-stage booster was making its eighth flight. Following stage separation, the first-stage booster returned to the Cape Canaveral landing zone, demonstrating SpaceX's ability to lower launch costs and shorten mission turnaround times through hardware reuse.
This launch not only demonstrated Falcon 9's mature mission execution capability, but also once again proved SpaceX's important position in the ISS cargo supply market. However, the successful launch failed to boost the stock price. On October 13, SpaceX (SPCX) closed down 4.21% at $156.54, touching an intraday low of $156.05.
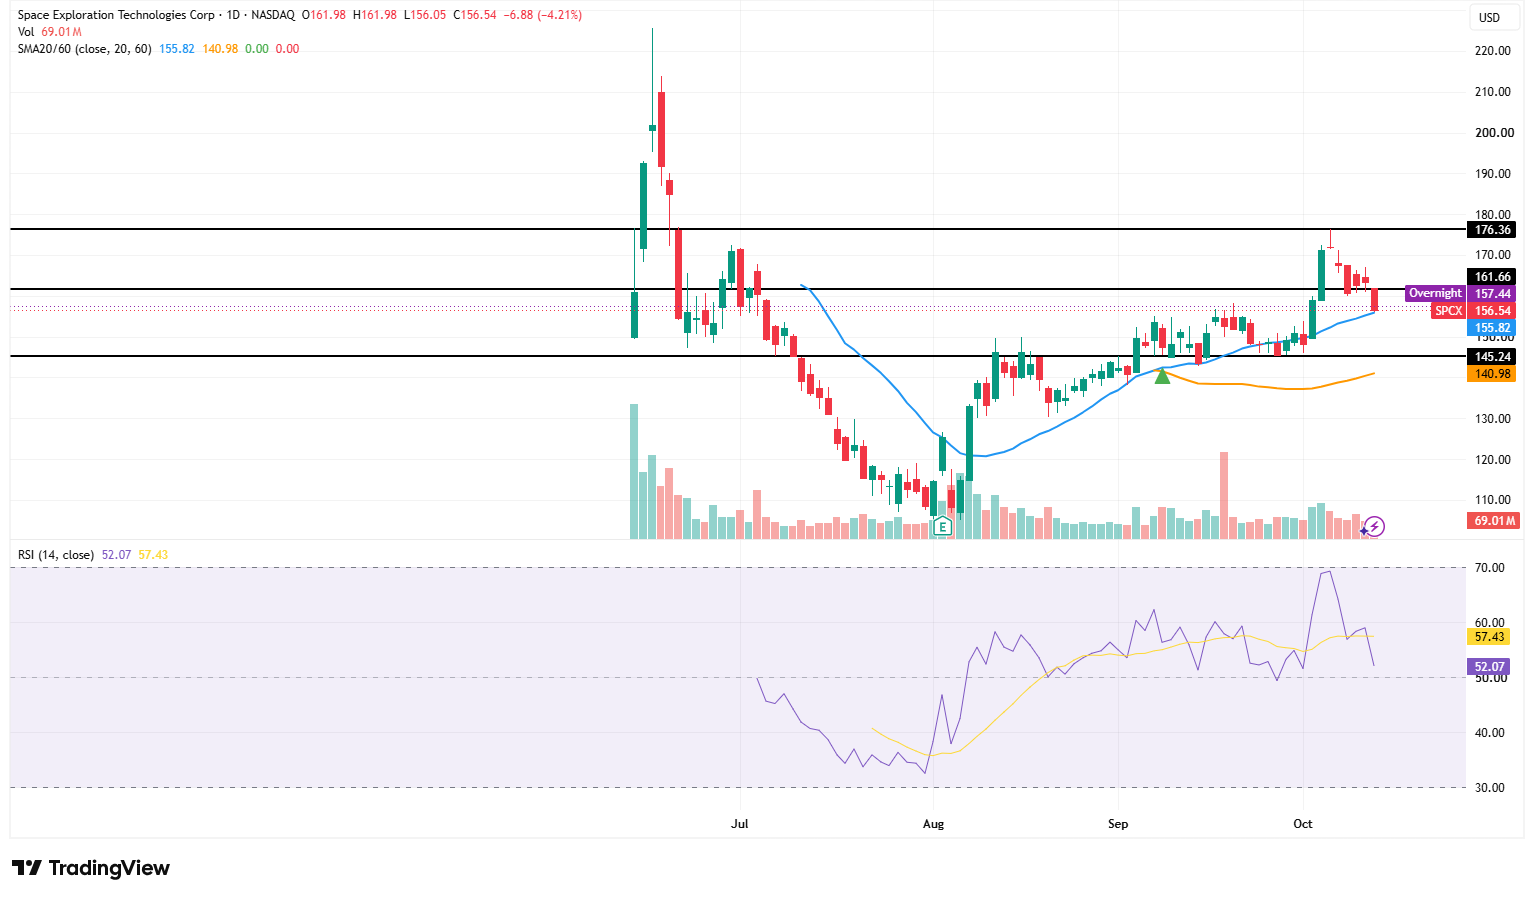
Source: TradingView
From the daily chart, SPCX fell 4.21% to close at $156.54, confirming a breakdown below the $160 round-number level. The stock had previously rallied to $172–$175 before pulling back continuously, indicating that the smooth completion of the mission failed to bring sustained buying interest and led to some profit-taking.
Currently, the stock remains slightly above its 20-day moving average of $155.82 and significantly above its 60-day moving average of $140.98, so the medium-term uptrend structure remains intact for now. However, the $156 area has become a key defensive level. If the stock closes below the 20-day moving average for consecutive days, the short-term adjustment could extend further to $150–$152, with subsequent attention on $145 and around the 60-day moving average at $141.
On the upside, the stock first needs to reclaim $160–$162, a region that has turned from support into resistance. If it holds firmly above $162 on heavy volume, the stock may retest $166–$168; after a further breakout, it would have the opportunity to test the previous high of $172–$175 again. Only a valid daily breakout above $175 can open up upside space toward $185 or even $200.
The RSI has pulled back from near 70 to 52.07 and fallen below its smoothed signal line at 57.43, indicating that upward momentum has cooled significantly, though it has not yet reached oversold territory. This suggests that the stock may continue to consolidate, with no clear oversold rebound signal formed just yet.
Recommended Articles


