


Johnson & Johnson Stock Forecast: ICOTYDE Data Strengthens Growth Story Before Q3 Earnings
TradingKey - Johnson & Johnson (JNJ) heads into Q3 with multiple positive catalysts. These include growth in the company’s pharmaceutical business, expansion in the MedTech business and the recently announced ICOTYDE data in psoriasis. The company closed at $261.44 on October 9, up 1.93% from the previous close. The primary catalyst is the expected third quarter earnings report to be released on October 13.
ICOTYDE Delivers Durable Two-Year Psoriasis Results
On October 9, J&J announced the two-year results of its Phase 3 ICONIC-LEAD study which showed durable responses through Week 112, for adults and adolescents with moderate-to-severe plaque psoriasis. At least 72% of patients treated with ICOTYDE (icotrokinra) achieved PASI 90, at least 70% of patients had clear or almost clear skin and at least 44% of patients achieved completely clear skin. No new safety signals were identified.
What’s interesting is that ICOTYDE is an approved commercial product. ICOTYDE is an oral, once-daily, IL-23 receptor peptide, which is approved in the U.S. and other global markets, including the EU, Japan and China.
The durability data for ICOTYDE is very exciting for the product and J&J as a company. J&J is also studying icotrokinra for other indications, including psoriatic arthritis and ulcerative colitis, which provides additional opportunities for label expansion.
Q2 Revenue Crossed $25 Billion
Sales for the quarter were $25.31 billion, with an adjusted operational increase of 5.7%. Adjusted net earnings for the quarter were $7.08 billion, a 5.7% increase over the prior year. Adjusted EPS for the quarter was $2.90, up from $2.77 for the prior year quarter.
Estimated year to date free cash flow was approximately $8.7 billion, up from $6.21 billion for the prior year. Management raised guidance for reported 2026 sales to $100.8 to $101.4 billion and adjusted EPS to $11.60 to $11.75.
J&J has said that surpassing $100 billion would be the first time revenue has reached that level in the 140 year history of the company.
Innovative Medicine Is Absorbing the STELARA Headwind
Innovative Medicine reported sales of $16.38 billion for Q2, up 7.8% reported and 6.8% operationally. Growth was from DARZALEX, CARVYKTI, TECVAYLI and RYBREVANT/LAZCLUZE in oncology, TREMFYA in immunology, SPRAVATO and CAPLYTA in neuroscience.
Operationally, innovation medicine growth was negatively impacted by STELARA biosimilar competition by about 760 basis points. Even with STELARA biosimilar competition, the Innovative Medicine segment grew operationally by about 7% for the quarter.
From an overall JNJ thesis perspective, this is a positive sign as a former blockbuster drug’s erosion is being offset by other, newer products.
Oncology and MedTech Broaden the Growth Base
J&J’s oncology portfolio is expanding with new products targeting multiple myeloma and lung cancer. Current and pipeline products targeting blood cancers and EGFR mutant lung cancer are also promising.
Revenues from MedTech products in Q2 increased by 4.5% to $8.93 billion, led by wound closure and biosurgery products, electrophysiology products, Shockwave, contact lenses, and trauma products.
With the recent acquisitions of Abiomed and Shockwave, and the continued development of OTTAVA, the cardiovascular franchise is expected to grow.
Talc Settlement Could Reduce a Long-Running Overhang
Talc litigation remains a key risk. In July, J&J reached a proposed settlement of at least $5.5 billion to resolve approximately 76,000 ovarian cancer claims.
The settlement requires support of at least 95% of the claimants, and the total amount could be as high as $7 billion.
Resolving the settlement would lessen an important valuation overhang. However, it does not preclude the possibility of future claims.
October 13 Earnings Are the Next Major Test
Johnson & Johnson (J&J) will hold its third quarter investor call on October 13 at 8:30 a.m. ET. I’ll pay special attention to the J&J oncology, immunology and neuroscience products, DARZALEX, CARVYKTI, RYBREVANT, TREMFYA, CAPLYTA and SPRAVATO as well as the pace of erosion of STELARA and the progress of their MedTech offerings. I will also listen to see if management maintains or increases their $100.8- $101.4 billion sales outlook.
What strengthens my fundamental view is the breadth of J&J’s replacement cycle across oncology, immunology and neuroscience as well as their Cardiovascular technologies. What would concern me is if the pace of erosion of STELARA picks up as well as weaker new products or lowered guidance.
Johnson & Johnson Technical Analysis: $265.36 Breakout Could Extend Recovery
Johnsons & Johnson closed at $261.44, up 1.93% for the day. This extends the prior day's bounce from the $251.45 to $255.16 support area. Overall daily structure is improving, with buyers defending the ascending trendline and the 100-day moving average, however, JNJ is still facing resistance at the 50-day moving average at $262.34.
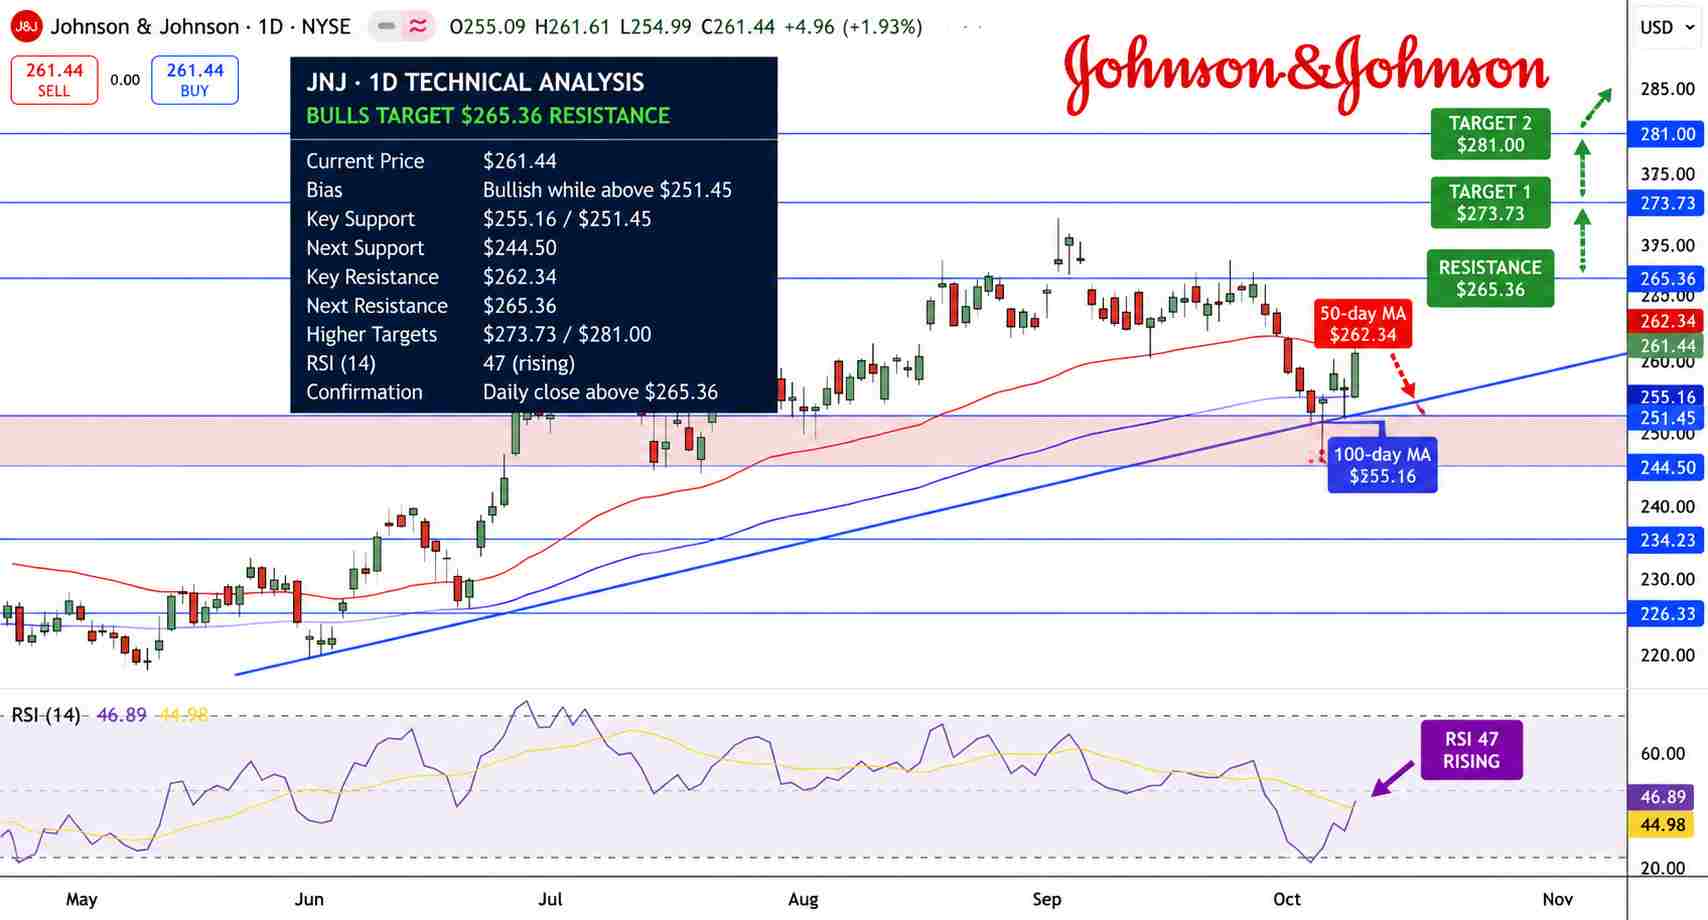
Johnson & Johnson Stock Price Chart - Source: Tradingview
RSI is around 47, with momentum moving above the signal line at 45. An RSI move above 50 would confirm the bullish shift in momentum.
The near-term resistance is $262.34 to $265.36. A daily close above $265.36 would target $273.73 and the previous high at $281.00.
The previous support of $255.16 to $251.45 is still likely to hold support. A daily close below $251.45 would negatively impact the near-term outlook and target $244.50 and $234.23.
Key Levels
The bias is bullish as long as JNJ trades above $255.16 to $251.45.
Major support areas: $255.16 to $251.45, $244.50, $234.23
Major resistance areas: $262.34 to $265.36, $273.73, $281.00
RSI: 47
Recovery/breakout trigger: Sustained daily close above $265.36
Breakdown trigger: Sustained daily close below $251.45
FAQs
Why is Johnson & Johnson stock in focus now?
JNJ is raised guidance, strong recent product growth and fresh two-year ICOTYDE data. All of this reinforces the post-STELARA growth story. Earnings are expected on October 13.
What technical level would confirm a stronger JNJ recovery?
A daily close above $265.36 would confirm a stronger recovery, with $273.73 and $281.00 possible next targets.
Bottom Line
Looking at JNJ overall, they have raised guidance and strong product growth. ICOTYDE continues to bolster innovative medicines. And, published data strengthen the immunology franchise. Oncology, neuroscience and cardiovascular products help offset the erosion from STELARA. Talc litigation is the largest legal concern. From a technical standpoint, JNJ is bullish above $251.45 to $255.16, with $265.36 being the critical breakout level.
Recommended Articles


