


Bond Market Volatility: History Says This Is the Smartest Investing Move Investors Can Make
Key Points
Fidelity research suggests that higher interest rates (and higher bond yields) don’t automatically lead to lower S&P 500 returns.
The S&P 500 has delivered annualized returns of more than 15% for the past 10 years, despite rising bond yields.
- 10 stocks we like better than Vanguard S&P 500 ETF ›
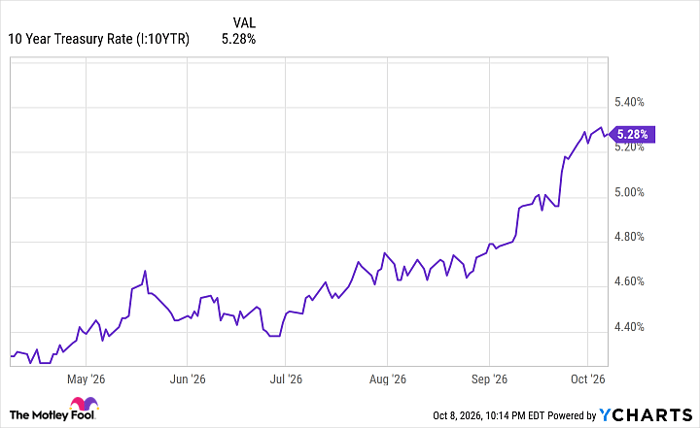
The bond market is giving investors some cause for concern. In the past few months alone, the 10-year U.S. Treasury bond yield has risen from below 4.4% to 5.28%.
Missed AI’s "Act 1"? Act 2 Could Be 15x Bigger. Most investors think they missed the AI boat because they didn't buy Nvidia in 2005. But according to our analysts, we’re only at the end of "Act 1"—the R&D phase. "Act 2" is the global rollout. Continue »
10 Year Treasury Rate data by YCharts
Higher bond yields mean higher borrowing costs. Money gets more expensive. That means higher mortgage rates, possibly a slowdown in new housing construction, less money spent at big-box stores, less money flowing into the economy, and more money going toward debt repayment. When the bond market gets volatile, that can be bad news for stock prices -- because investors start to worry if higher business borrowing costs will hurt future corporate profits.
But do higher bond yields (and lower bond prices) have to be bad news for stock market investors? Not necessarily. Today's bond market volatility may be mostly a healthy adjustment and a sign of strong economic growth.
Let's look at what higher volatility (and higher yields) in the bond market mean for your stock portfolio -- and why the smartest move might be to "do nothing" for now.

Image source: Getty Images.
Rising interest rates aren't always bad news for stocks
A common bit of conventional wisdom is that higher bond yields (and higher interest rates) are always bad for stock prices. But this isn't 100% true. Researchers from Fidelity looked at 34 years of S&P 500 (SNPINDEX: ^GSPC) past performance to see how the stock market did during times of rising interest rates from Federal Reserve rate hikes.
According to Fidelity's analysis, from January 1992 to April 2026, higher interest rates often led to higher S&P 500 returns over the next 12 months -- as long as the Fed was raising interest rates alongside signs of strong economic growth. A strong, growing economy might be more important for the stock market than the latest moves in the bond market.
Higher interest rates (and bond yields) don't automatically predict lower stock market gains. Higher bond yields can be a sign of investor optimism about the economy -- when the economy is growing strongly, investors want to be paid more to hold relatively safe, "boring," slow-growing fixed-income investments. Higher bond yields might also say more about how investors feel about the risks of government debt and the massive amounts of new corporate bonds being issued by major artificial intelligence (AI) companies than they do about the stock market.
Whatever the reason for today's volatility in the bond market, stock investors should take heart and avoid knee-jerk reactions. In the next few years, we could have both higher bond yields and higher S&P 500 returns.
What to do next: Stay the course with investing in stocks
Understandably, some investors get nervous when the stock market has been "too good" for "too long." No bull market lasts forever. But this one might not be over yet. And even if stocks do go through a 10% downturn (correction) or enter a 20% sell-off (bear market) in 2027, the long-term performance of the S&P 500 offers reason for hope.
Remember, the S&P 500 has delivered average annual returns of 9.98% since 1928. Even those "average" returns can make you much richer in the long run. It's worth holding on to your stocks and keep buying as often as you can, even if there are short-term moments of fear, volatility, or a few big crashes along the way.
Keep in mind that the Vanguard S&P 500 ETF (NYSEMKT: VOO), one of the most popular low-cost S&P 500 index funds, has delivered annualized returns of more than 15% for the past 10 years and about 13.8% for the past five years. Even though interest rates have risen significantly during that time, VOO has continued to deliver strong returns for investors.
Bond yields are near their highest levels in decades, and they might go higher. But this is no reason to panic or change your plans to invest in stocks. The smartest investors are staying the course. No matter what happens in the bond market, it's usually a good idea to keep buying stocks as part of your long-term goals.
Should you buy stock in Vanguard S&P 500 ETF right now?
Before you buy stock in Vanguard S&P 500 ETF, consider this:
The Motley Fool Stock Advisor analyst team just identified what they believe are the 10 best stocks for investors to buy now… and Vanguard S&P 500 ETF wasn’t one of them. The 10 stocks that made the cut could produce monster returns in the coming years.
Consider when Netflix made this list on December 17, 2004... if you invested $1,000 at the time of our recommendation, you’d have $379,123!* Or when Nvidia made this list on April 15, 2005... if you invested $1,000 at the time of our recommendation, you’d have $1,408,822!*
Now, it’s worth noting Stock Advisor’s total average return is 950% — a market-crushing outperformance compared to 215% for the S&P 500. Don't miss the latest top 10 list, available with Stock Advisor, and join an investing community built by individual investors for individual investors.
See the 10 stocks »
*Stock Advisor returns as of October 12, 2026.
Ben Gran has no position in any of the stocks mentioned. The Motley Fool has positions in and recommends Vanguard S&P 500 ETF. The Motley Fool has a disclosure policy.
Recommended Articles


