


I Think BND Is the Best Bond ETF for Most Investors: Here's Why I'm Buying More in 2026.
Key Points
The Vanguard Total Bond Market ETF invests in high-quality bonds.
Rising rates have pushed down bond values, lifting yields.
BND offers a great combination of diversification, low costs, and an attractive current yield.
- 10 stocks we like better than Vanguard Total Bond Market ETF ›
Vanguard Total Bond Market ETF (NASDAQ: BND) has everything most investors would want in a bond ETF. It provides instant diversification across more than 11,400 bonds, an ultra-low 0.3% expense ratio, and a starting yield of more than 5%, comparable to its 2008 peak. That's an attractive combination for investors seeking a low-risk passive income investment.
Here's why I'm buying more of this top bond ETF in 2026.
Missed AI’s "Act 1"? Act 2 Could Be 15x Bigger. Most investors think they missed the AI boat because they didn't buy Nvidia in 2005. But according to our analysts, we’re only at the end of "Act 1"—the R&D phase. "Act 2" is the global rollout. Continue »
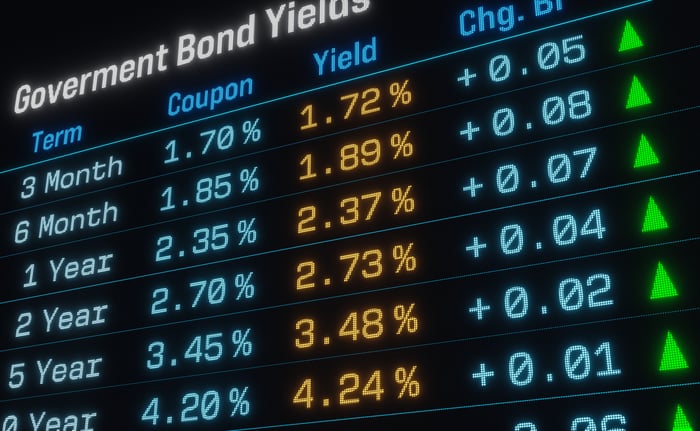
Image source: Getty Images.
What makes BND a top bond ETF?
The Vanguard Total Bond Market ETF provides broad exposure to the taxable investment-grade U.S. dollar-denominated bond market (excluding inflation-protected and tax-exempt bonds). It currently holds over 11,400 bonds from a range of issuers, including the U.S. Government (nearly 69% of its holdings). U.S. government bonds are among the safest in the world, while investment-grade corporate bonds are lower-risk, fixed-income investments. BND's focus on high-quality bonds makes it an ideal investment for diversifying a stock-heavy portfolio.
While the ETF holds a range of bonds by maturity, most mature over the next one to 10 years (79% of its holdings). BND has an average effective maturity of 8.2 years. That makes it best for investors seeking reliable income over the medium- to long-term.
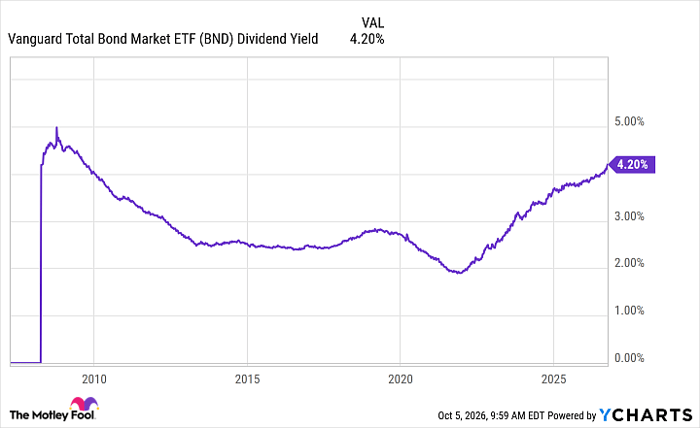
The ETF's holdings currently have an average coupon (interest rate) of 3.9%. However, the yield to maturity is even higher at 5%. That backs the fund's current distribution yield of 5.1%, which is around its highest level since 2008:
BND Dividend Yield data by YCharts
Investors get access to this high-quality bond portfolio for a very reasonable cost, as its 0.03% expense ratio is one of the lowest in the industry.
Why is now a good time to buy bonds?
The 10-year Treasury yield recently hit a 24-year high at 5.3%, its highest level since April 2002. That's up from nearly 4% in late February, before the war with Iran caused a spike in energy prices, driving a resurgence in inflation. That recent uptick in inflation led the Federal Reserve to begin raising interest rates for the first time in three years. The Fed will likely continue to hike rates until inflation gets back under control.
Higher rates weigh on the value of existing bonds, causing their current yields to rise. That's one reason why BND has its highest current yield in nearly two decades. Its value has fallen about 7% from its peak earlier this year. Meanwhile, with rates rising, new bond investments carry higher yields, which is helping boost BND's yield.
The current high starting yield is worth noting because it has historically driven most of BND's return over the next 10-year period. For example, the last time BND's yield was above 5% (October 2008), it delivered a 4.9% average annual total return over the next decade, even though the Federal Funds Rate was near zero for half that period. For comparison, BND's average annual return over this past decade was only 1.1%. That suggests now is a historically attractive time to invest in bonds.
What are the risks of investing in BND now?
While investment-grade bonds are lower-risk investments, they're not without risk. Due to the decline in bond values this year, BND's year-to-date total return is -2.7%. The value of BND could continue to decline if rates keep rising.
Meanwhile, the 5% current yield-to-maturity isn't guaranteed. It reflects the current average yield of the bonds held by the ETF. As holdings mature, and BND purchases new investments, its yield could rise or fall, depending on prevailing rates.
Why I'm buying more BND in 2026
I currently have a small position in BND. However, given where its yield sits these days, I'm adding to my position in 2026. Its nearly 5% yield to maturity is the highest in about two decades and a much better entry point than it has offered in years. Add in its low costs and instant diversification across high-quality bonds, and it's a top-notch bond fund to build on the fixed-income side of my portfolio.
BND's combination of low costs, diversification, and relatively high starting yield is also why I think it's the best bond ETF for most investors to consider. It can add ballast and diversification benefits to almost any portfolio at a time when getting more defensive makes sense.
Should you buy stock in Vanguard Total Bond Market ETF right now?
Before you buy stock in Vanguard Total Bond Market ETF, consider this:
The Motley Fool Stock Advisor analyst team just identified what they believe are the 10 best stocks for investors to buy now… and Vanguard Total Bond Market ETF wasn’t one of them. The 10 stocks that made the cut could produce monster returns in the coming years.
Consider when Netflix made this list on December 17, 2004... if you invested $1,000 at the time of our recommendation, you’d have $361,650!* Or when Nvidia made this list on April 15, 2005... if you invested $1,000 at the time of our recommendation, you’d have $1,437,517!*
Now, it’s worth noting Stock Advisor’s total average return is 936% — a market-crushing outperformance compared to 213% for the S&P 500. Don't miss the latest top 10 list, available with Stock Advisor, and join an investing community built by individual investors for individual investors.
See the 10 stocks »
*Stock Advisor returns as of October 6, 2026.
Matt DiLallo has positions in Vanguard Total Bond Market ETF. The Motley Fool has positions in and recommends Vanguard Total Bond Market ETF. The Motley Fool has a disclosure policy.
Recommended Articles


