


This Rare Market Signal Has Appeared Only 2 Times in a Century. Here Is What History Says Comes Next.
Key Points
The S&P 500 has soared in recent years, but headwinds have emerged in recent times.
History doesn’t always repeat itself, but it offers us an idea of what’s likely to happen in certain situations.
- 10 stocks we like better than S&P 500 Index ›
The S&P 500 has been a winning bet for investors over the past few years as the bull market roared on -- and continues to advance. The famous benchmark delivered a 78% gain in the three calendar years and is heading for an 11% increase in 2026. Investors have been excited about the potential of artificial intelligence (AI) to transform corporate earnings -- pushing the revenue of many companies significantly higher -- and as a result, have piled into stocks involved in the space. Since many of these players are heavily weighted in the S&P 500, this has pushed the index higher, too.
In this sunny picture, though, a few dark clouds have appeared. Investors have worried about rising inflation, ongoing turmoil in Iran, and even the future AI growth outlook. With tech giants spending nearly $700 billion this year alone on AI infrastructure expansion, some investors have questioned whether the revenue opportunity will make such an enormous investment worthwhile. All of these concerns have prompted the indexes to slip temporarily here and there, but the overall positive performance has continued.
Missed AI’s "Act 1"? Act 2 Could Be 15x Bigger. Most investors think they missed the AI boat because they didn't buy Nvidia in 2005. But according to our analysts, we’re only at the end of "Act 1"—the R&D phase. "Act 2" is the global rollout. Continue »
Against this backdrop, a rare market signal has emerged -- one that's only appeared twice in a century. History offers us an idea about what comes next.

Image source: Getty Images.
Market performance this year
So first, let's take a deeper dive into market performance this year. As mentioned, AI stocks and the S&P 500 have continued to climb. But the elements I mentioned above have slowed down the momentum. For example, higher inflation -- and the recent interest rate hike designed to tame it -- weighs on the consumer's wallet and adds to corporate costs. This presents a hurdle for companies that are involved in a growth phase or those that prioritize growth, such as tech players.
Considering this, investors earlier in the year broadened their investments beyond tech -- the stars of last year -- and into industries seen as "safer" such as pharmaceutical stocks and consumer-related players that sell essentials. Still, AI companies like Nvidia and Micron Technology continued to report soaring earnings and high demand, and overall, companies across industries have been reporting sustained earnings growth. In the second quarter, 86% of S&P 500 companies surpassed earnings per share estimates, according to FactSet Insight, noting that it's the highest since 2021.
All of that has helped buoy the S&P 500, even as concerns linger in the background. Now this brings me to the market signal that investors shouldn't ignore. This rare signal has appeared only twice -- and that's including the present time -- in a century. And it has to do with valuation. The S&P 500 Shiller CAPE ratio has surpassed the level of 40, as it did during the dot-com bubble.
A clear message for investors
This offers us a clear message: Stocks are historically expensive right now. The S&P 500 Shiller CAPE ratio is a particularly reliable measure because it looks at price and earnings per share over a 10-year period, accounting for economic shifts.
Now, let's consider what history tells us about such a situation. The last time stocks were this expensive, during the dot-com bubble, a crash followed. And a look at other points over the past century shows us that when valuations climb significantly and reach what seems to be a peak, stock market declines follow.
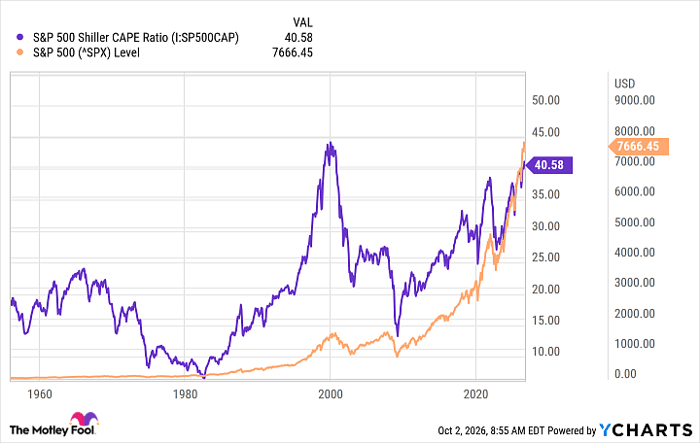
S&P 500 Shiller CAPE Ratio data by YCharts
But here's some good news. History also reveals two other elements, and these are positive for investors. First, every decline isn't necessarily a crash or a long-lasting downturn. In some instances, the market may pull back and then progress higher again. And second, on every occasion -- even after the worst of crashes -- the market has always recovered. The S&P 500 has always gone on to gain over time, and quality stocks have done the same.
So, even if history tells us that declines may be just ahead, that isn't a problem for the long-term investor. You're still likely to win if you hold onto a portfolio of strong stocks over time.
Should you buy stock in S&P 500 Index right now?
Before you buy stock in S&P 500 Index, consider this:
The Motley Fool Stock Advisor analyst team just identified what they believe are the 10 best stocks for investors to buy now… and S&P 500 Index wasn’t one of them. The 10 stocks that made the cut could produce monster returns in the coming years.
Consider when Netflix made this list on December 17, 2004... if you invested $1,000 at the time of our recommendation, you’d have $361,650!* Or when Nvidia made this list on April 15, 2005... if you invested $1,000 at the time of our recommendation, you’d have $1,437,517!*
Now, it’s worth noting Stock Advisor’s total average return is 936% — a market-crushing outperformance compared to 211% for the S&P 500. Don't miss the latest top 10 list, available with Stock Advisor, and join an investing community built by individual investors for individual investors.
See the 10 stocks »
*Stock Advisor returns as of October 4, 2026.
Adria Cimino has no position in any of the stocks mentioned. The Motley Fool has positions in and recommends Micron Technology and Nvidia. The Motley Fool has a disclosure policy.
Recommended Articles


