

AMD Stock Price Forecast: Stock Hits Record High, Eyes Next Target of $732

Source Tradingkey

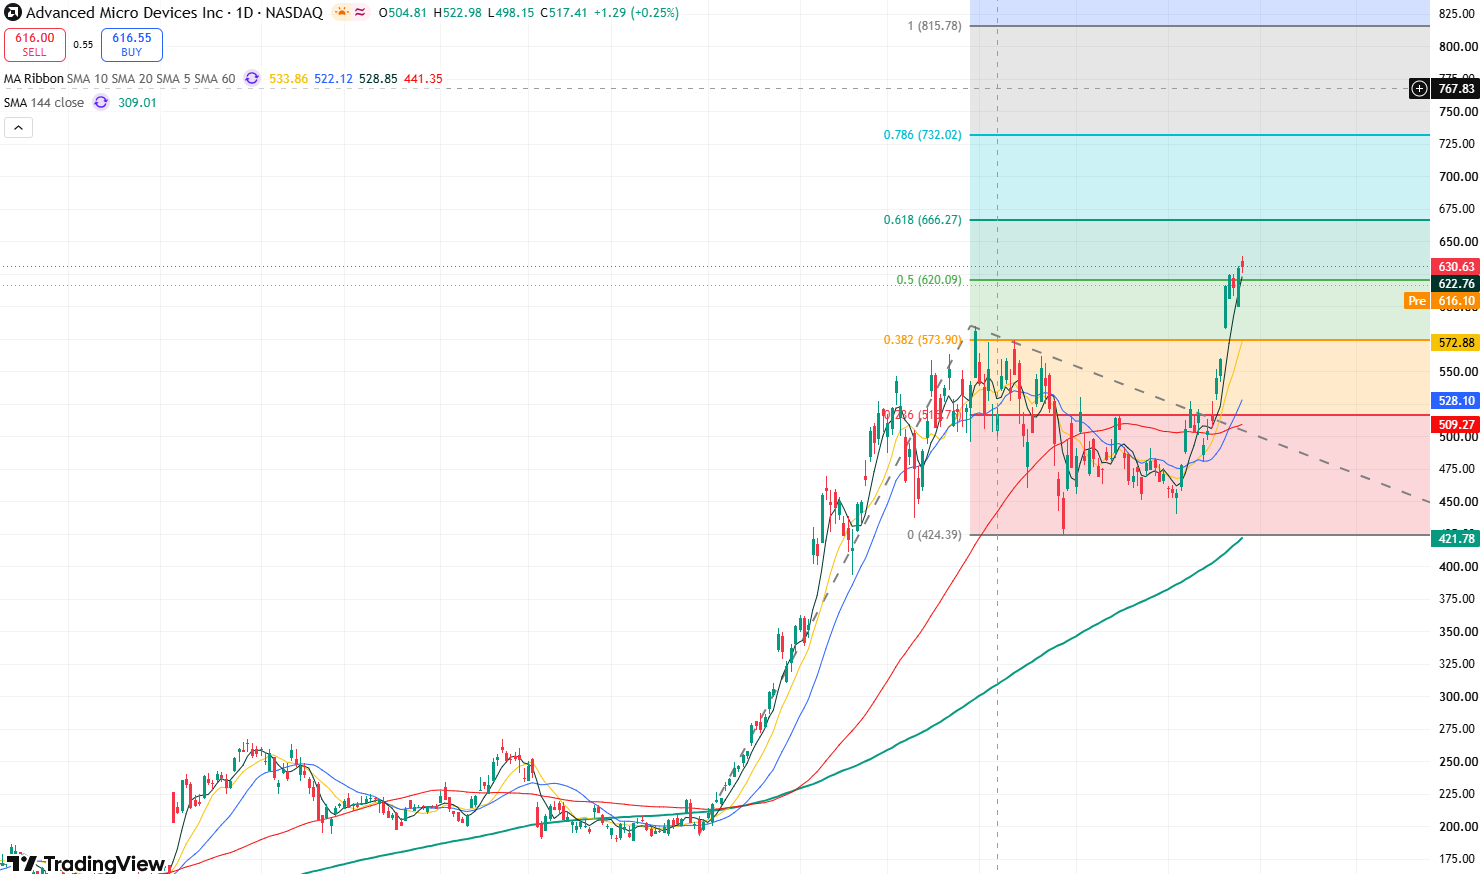
TradingKey - As of the close on September 25 Eastern Time, AMD (AMD) stock price set another all-time high, closing at $630.63 after reaching an intraday high of $639, up 0.22% on the day. Previously, AMD surged on September 21, crossing $1 trillion in market capitalization for the first time, and its stock price has since sustained above $600.
amd-be40b67176a9457696cca7444fc34bba

AMD daily stock price chart, Source: TradingView

From the perspective of moving averages, AMD's 5-day moving average currently stands at $622.76, the 10-day moving average at $572.88, and the 20-day moving average at $528.10. The short-to-medium-term moving averages maintain a bullish alignment, with the stock price continuing to trade well above major moving averages, indicating that the overall uptrend remains intact.

In terms of momentum indicators, the 14-day RSI stands at 73, entering overbought territory. This indicates a rapid short-term gain, increasing the risk of high-level consolidation or profit-taking. As for the MACD, the MACD line remains above the signal line, with the histogram staying in positive territory, suggesting that the current upward momentum has not significantly weakened.

In the short term, immediate resistance on the upside is near the previous high of $640. If the stock continues to set new all-time highs, it will test the 0.618 Fibonacci extension level at $666. If it can hold firmly above this level, it will open up upside room toward $700-$732.

On the downside, initial support is near $620-$623, close to the 5-day moving average. A breakdown below this level could lead to a further retest of the $600 psychological mark. Further down, more crucial medium-term support lies around the previous breakout zone of $584-$585.

Disclaimer: For information purposes only. Past performance is not indicative of future results.
placeholder
Markets on a Wire: Imminent US Inflation Data Threatens to Lock In Fed Rate Hikes Imminent CPI and PPI data threaten to lock in a hawkish Federal Reserve rate hike cycle, leaving gold, tech equities, and Bitcoin highly vulnerable to a programmatic sell-off.
Author  Mitrade Team
Jun 09, Tue
Imminent CPI and PPI data threaten to lock in a hawkish Federal Reserve rate hike cycle, leaving gold, tech equities, and Bitcoin highly vulnerable to a programmatic sell-off.
placeholder
XRP Price Prediction for July 2026: Can Buyers Finally Break the Downtrend?XRP (XRP) price trades near $1.05, caught between a year-long downtrend and a sudden burst of buying.July has historically rewarded XRP holders. This year the month arrives with on-chain accumulation
Author  Beincrypto
Jun 30, Tue
XRP (XRP) price trades near $1.05, caught between a year-long downtrend and a sudden burst of buying.July has historically rewarded XRP holders. This year the month arrives with on-chain accumulation
placeholder
XAUUSD Gold Analysis: Gold Holds Above $4,350 Ahead of US Inflation Data Is $4,500 Next? Gold holds above $4,350 following weak US jobs data. As inflation reports approach and UBS eyes $5,000, can XAUUSD break resistance at $4,435 to rally toward $4,500?
Author  Naoufal Seddik
Aug 12, Wed
Gold holds above $4,350 following weak US jobs data. As inflation reports approach and UBS eyes $5,000, can XAUUSD break resistance at $4,435 to rally toward $4,500?
placeholder
Gold Price Analysis Today: Gold Drops 1.32% Despite Lower Fed Rate-Hike Bets, Can $4,313 Support Hold? Gold fell 1.32% on August 13 after rising to $4,449.73, then reversing lower and closing near $4,349.918 below the $4,356.46 support. Softer US inflation data reduced Fed rate hike expectations, but selling pressure still dominated the session. Will $4,313 support hold?
Author  Naoufal Seddik
Aug 14, Fri
Gold fell 1.32% on August 13 after rising to $4,449.73, then reversing lower and closing near $4,349.918 below the $4,356.46 support. Softer US inflation data reduced Fed rate hike expectations, but selling pressure still dominated the session. Will $4,313 support hold?
placeholder
Gold Price Analysis Today: Gold Gains 0.94% as Markets Expect Fed to Hold Rates, Can $4,449 Resistance Break? Gold gained 0.94% on August 17, closing near $4,417.30 as softer US data strengthened expectations for unchanged Fed rates in September. Gold remains bullish, with $4,449.730 resistance and $4,310.650 support in focus.
Author  Naoufal Seddik
Aug 18, Tue
Gold gained 0.94% on August 17, closing near $4,417.30 as softer US data strengthened expectations for unchanged Fed rates in September. Gold remains bullish, with $4,449.730 resistance and $4,310.650 support in focus.
goTop
quote