


As Stock Market Warning Signs Pile Up, Here's What History Says Comes Next
Key Points
Based on metrics like the CAPE ratio and Buffett indicator, stocks are trading at historically high valuations.
In addition, stocks generally perform poorly during Fed rate-tightening cycles.
- 10 stocks we like better than S&P 500 Index ›
The stock market appears to be on its way to another strong year, with the S&P 500 (SNPINDEX: ^GSPC) once again up by double-digit percentages. However, warning signs of a potential market pullback have been growing, including the S&P 500 hitting rarely seen valuation levels and the Federal Reserve starting to raise interest rates.
Let's look at what history says about situations like this and whether there is reason to believe that history will repeat itself or if this time will be different.
Missed Nvidia in 2009? This Rare Signal Is Flashing Again. In 2009, a "Double Down" signal flashed for a little-known chipmaker called Nvidia. For the first time in years, that same "Total Conviction" signal is flashing for a company 1/100th the size of Nvidia. Continue »
Image source: Getty Images
Stocks are at historically high valuations
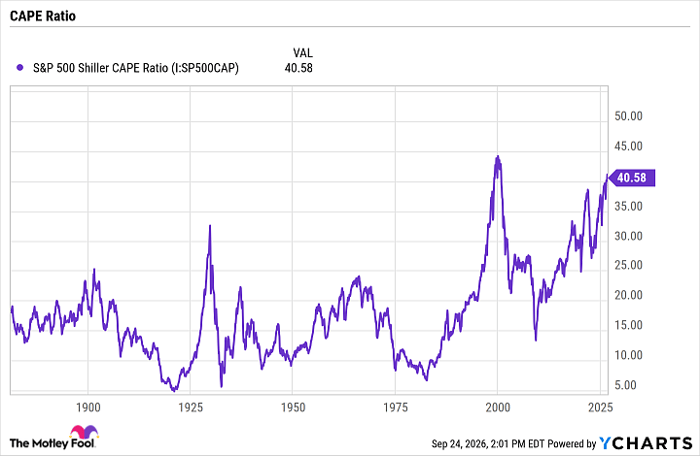
There are a variety of ways to value the stock market, but one of the more popular is the S&P 500 cyclically adjusted price-to-earnings (CAPE) ratio. Developed by famed economist Robert Shiller, this valuation metric was devised to help smooth out cyclical boom-bust profit cycles and show a better picture of the market's earnings power as opposed to conventional P/E ratios, which can be greatly influenced by economic cycles. It does this by taking the S&P 500's current price and dividing it by its average annual earnings adjusted for inflation over the past decade.
The metric was designed to be an indicator of potential future market returns over the following decade, but it has often been used to help predict market crashes. The S&P 500 has historically traded at an average CAPE ratio in the mid-17s, but it's often climbed to high levels preceding market crashes, including around 27 before the Great Recession and near 30 before the Great Crash of 1929.
The CAPE ratio climbed above 40 earlier this year and has remained above that mark. The only other time the market has hit this level, going back into the 1800s, was during the dot-com bubble before the market crashed.
Data by YCharts.
Another popular valuation for the S&P 500, which has surged to new all-time highs, is the so-called Buffett indicator. The valuation metric is a favorite of legendary investor Warren Buffett. It measures the value of the entire stock market, as reflected by the Wilshire 5000 Index divided by the U.S. gross domestic product (GDP). A reading between 75% and 90% is considered a reasonable valuation, while above 120% is viewed as overvalued. The metric has recently reached an all-time high, soaring to above 235%. The ratio reached high levels before the dot-com crash and the global financial crisis, but it's generally been climbing to new highs since late 2017.
The impact of higher interest rates
In addition to the market reaching some rarely seen valuation levels, the Federal Reserve has started raising interest rates. It raised its benchmark interest rate by 25 basis points earlier this month, bringing it to a range of 3.75% to 4%, and indicated that another increase was coming later this year.
Historically, rate increase cycles have not been good for stocks. Since the Fed began announcing its target rates in 1994, its embarked on six rate-tightening cycles. RBC Wealth Management notes that during five of those cycles, the market sank from its peak by between 8% and 14%.
A Fed tightening cycle was also the catalyst for the last bear market in 2022. The S&P fell 25% and eventually hit its trough roughly seven months after the Fed's initial rate hike.
Will history repeat, or is this time different?
The honest answer is that no one knows. While some bear market warning signs are flashing, the sample sizes for these aren't large enough to be statistically relevant. They are also countered by the fact that the S&P 500 has risen 95% of the time in the following 12 months after midterm elections since 1938.
AI has also changed the playing field. Unlike past tech cycles, which have been limited by the number of people on the planet (you can only provide so many internet connections or smartphones), demand for AI can be almost limitless. Meanwhile, the S&P 500 today is dominated by megacap tech companies with much less cyclical business than in the past, and that are generally trading at reasonable valuations based on near-term projections.
As such, I would not change any core strategies -- such as dollar-cost averaging into index exchange-traded funds (ETFs) or investing in stocks with wide moats and durable compounding businesses -- based on a potential market pullback.
Should you buy stock in S&P 500 Index right now?
Before you buy stock in S&P 500 Index, consider this:
The Motley Fool Stock Advisor analyst team just identified what they believe are the 10 best stocks for investors to buy now… and S&P 500 Index wasn’t one of them. The 10 stocks that made the cut could produce monster returns in the coming years.
Consider when Netflix made this list on December 17, 2004... if you invested $1,000 at the time of our recommendation, you’d have $383,680!* Or when Nvidia made this list on April 15, 2005... if you invested $1,000 at the time of our recommendation, you’d have $1,382,954!*
Now, it’s worth noting Stock Advisor’s total average return is 937% — a market-crushing outperformance compared to 214% for the S&P 500. Don't miss the latest top 10 list, available with Stock Advisor, and join an investing community built by individual investors for individual investors.
See the 10 stocks »
*Stock Advisor returns as of September 27, 2026.
Geoffrey Seiler has no position in any of the stocks mentioned. The Motley Fool has no position in any of the stocks mentioned. The Motley Fool has a disclosure policy.
Recommended Articles


