


Alibaba Group vs. Uber Technologies: Examining Quarterly Revenue Trends
Key Points
Alibaba consistently generates a significantly higher absolute volume of total revenue across all measured periods, while Uber repeatedly demonstrates a noticeably faster overall rate of expansion.
Uber displays a continuous upward trajectory punctuated by occasional quarter-over-quarter dips, while Alibaba consistently maintains a notably seasonal business pattern featuring distinct and recurring quarter-over-quarter fluctuations.
Investors evaluating the financial metrics of the two companies should watch whether the revenue growth gap between them continues to narrow or begins to widen again over the next several reporting cycles.
- 10 stocks we like better than Alibaba Group ›
Alibaba Group: Revenue Scale and Seasonal Fluctuations
Alibaba Group Holding (NYSE:BABA) primarily earns revenue by operating extensive online e-commerce retail distribution networks, providing comprehensive cloud computing technology capabilities, facilitating complex international logistics solutions, and managing digital media entertainment services for global enterprises and consumers.
It recently completed a $10.2 billion ordinary share placement intended to fund advanced computing infrastructure, while concurrently navigating newly filed securities fraud class action lawsuits concerning specific government regulatory designations during the period.
Uber Technologies: Sequential Revenue Expansion and Slower Growth
Uber Technologies (NYSE:UBER) primarily generates revenue by operating an expansive global digital application ecosystem that directly connects smartphone consumers worldwide with a diverse variety of independent transportation, ride-hailing, and local retail delivery service providers.
It formally published a comprehensive statutory offer document to acquire all outstanding shares in Delivery Hero, and it simultaneously launched a new autonomous ride-hailing service across multiple European testing markets alongside regional partners.
Why Revenue Matters for Investors
Revenue measures total gross sales to indicate overall enterprise scale before deducting typical operating expenses. This metric serves as a fundamental baseline indication of overall consumer demand and business growth.
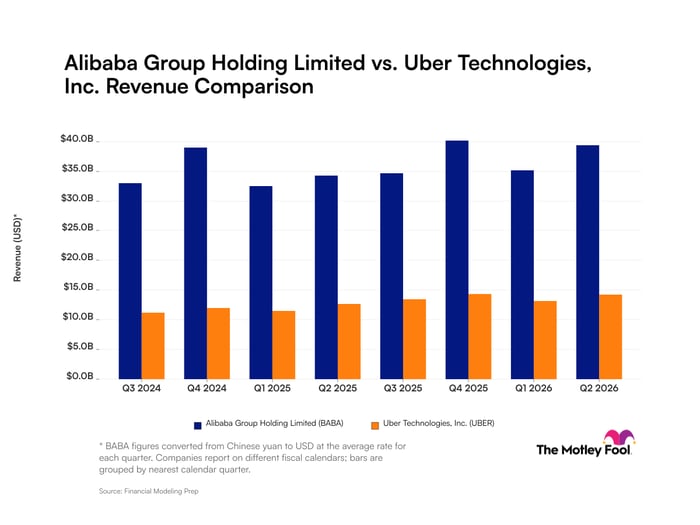
Quarterly Revenue: Alibaba Group vs. Uber Technologies
| Calendar quarter | Alibaba Group Holding Revenue | Uber Technologies Revenue |
|---|---|---|
| Q3 2024 | $33.0 billion (quarter ended Sept. 30, 2024) | $11.2 billion (quarter ended Sept. 30, 2024) |
| Q4 2024 | $38.9 billion (quarter ended Dec. 31, 2024) | $12.0 billion (quarter ended Dec. 31, 2024) |
| Q1 2025 | $32.5 billion (quarter ended March 31, 2025) | $11.5 billion (quarter ended March 31, 2025) |
| Q2 2025 | $34.2 billion (quarter ended June 30, 2025) | $12.7 billion (quarter ended June 30, 2025) |
| Q3 2025 | $34.6 billion (quarter ended Sept. 30, 2025) | $13.5 billion (quarter ended Sept. 30, 2025) |
| Q4 2025 | $40.2 billion (quarter ended Dec. 31, 2025) | $14.4 billion (quarter ended Dec. 31, 2025) |
| Q1 2026 | $35.1 billion (quarter ended March 31, 2026) | $13.2 billion (quarter ended March 31, 2026) |
| Q2 2026 | $39.6 billion (quarter ended June 30, 2026) | $14.2 billion (quarter ended June 30, 2026) |
Data source: Financial Modeling Prep. Alibaba Group Holding's figures are converted from Chinese yuan to U.S. dollars. Data as of Sept. 21, 2026.
Foolish Take
Alibaba and Uber are two technology companies experiencing a seismic shift in their businesses due to the artificial intelligence boom. The former maintains steady year-over-year sales growth, but its bottom line is being impacted by the capital expenditures needed to build out its AI infrastructure. For instance, its second-quarter revenue of $39.6 billion represented a 9% increase over 2025, yet its net income dropped 75% to $1.5 billion.
This trade-off makes sense. While Alibaba's mature e-commerce business delivered 4% year-over-year growth in Q2 sales, its AI cloud and compute division experienced an impressive 45% revenue increase compared to 2025. Tracking the Chinese conglomerate's sales in the subsequent quarters will prove essential to understanding the ongoing success of its AI operations.
Uber has established partnerships around the world to support the rise of autonomous vehicles (AVs). On Sept. 3, the company and its AV partner Wayve launched the first self-driving car rides in London.
As it sets up its AI-powered future through AVs, Uber's human-based delivery services business continues to grow at a much faster pace than Alibaba's core e-commerce operations. The ride-hailing company's $14.2 billion in Q2 sales represented 12% year-over-year growth.
Should you buy stock in Alibaba Group right now?
Before you buy stock in Alibaba Group, consider this:
The Motley Fool Stock Advisor analyst team just identified what they believe are the 10 best stocks for investors to buy now… and Alibaba Group wasn’t one of them. The 10 stocks that made the cut could produce monster returns in the coming years.
Consider when Netflix made this list on December 17, 2004... if you invested $1,000 at the time of our recommendation, you’d have $386,781!* Or when Nvidia made this list on April 15, 2005... if you invested $1,000 at the time of our recommendation, you’d have $1,379,943!*
Now, it’s worth noting Stock Advisor’s total average return is 936% — a market-crushing outperformance compared to 213% for the S&P 500. Don't miss the latest top 10 list, available with Stock Advisor, and join an investing community built by individual investors for individual investors.
See the 10 stocks »
*Stock Advisor returns as of September 25, 2026.
Robert Izquierdo has positions in Alibaba Group and Uber Technologies. The Motley Fool recommends Alibaba Group and Uber Technologies. The Motley Fool has a disclosure policy.
Recommended Articles


