


Prediction: This Dividend Growth ETF Will Outperform SCHD Over the Next Decade. Here's Why.
Key Points
The iShares Core Dividend Growth ETF already has a track record of beating the Schwab U.S. Dividend Equity ETF.
That trend will likely continue over the next decade.
A larger allocation to technology stocks helps the iShares ETF’s case.
- 10 stocks we like better than iShares Trust - iShares Core Dividend Growth ETF ›
"Past performance isn't a guarantee of future outcomes," or some derivative of that saying, is often mentioned in investing. It's common for it, or an equivalent verse, to even appear in the fund industry's fine print.
Basically, fund company lawyers say it's OK to highlight past performance, but issuers have to tell investors that the good times may not last forever. It's worth remembering that with exchange-traded funds (ETFs), today's stars aren't guaranteed to retain their leadership for years on end. However, there are some examples where long-term durability is apparent.
Missed Nvidia in 2009? This Rare Signal Is Flashing Again. In 2009, a "Double Down" signal flashed for a little-known chipmaker called Nvidia. For the first time in years, that same "Total Conviction" signal is flashing for a company 1/100th the size of Nvidia. Continue »

This iShares dividend ETF will likely continue beating its Schwab rival over the next decade. Image source: Getty Images.
So I'm comfortable wagering the iShares Core Dividend Growth ETF (NYSEMKT: DGRO) will beat the vaunted Schwab U.S. Dividend Equity ETF (NYSEMKT: SCHD) over the next decade, and history is only part of the equation.
DGRO can do it again
If ETFs could be described as rock stars, the Schwab dividend ETF would certainly fit that bill, because this $113 billion juggernaut is the largest product in the dividend ETF camp. It's more than twice the size of the iShares rival mentioned here.
Fanning the flames of that popularity is the fact that the Schwab fund is beating the S&P 500 this year by more than 2-to-1, due in part to a 14.1% weight in the energy sector. Throw in a combined 41.1% weight to consumer staples and healthcare, and it's evident that the Schwab fund has defensive value tendencies. In other words, it's a tailwind for the Schwab ETF when value stocks are in fashion.
Yes, growth stocks have been the place to be for more than a decade, but to the Schwab ETF's credit, just four dividend ETFs outperformed it over that period. One member of that quartet was the iShares ETF. In fact, the nearly 256% returned by the iShares fund over the decade ending Aug. 31 was surpassed by just two competing ETFs.
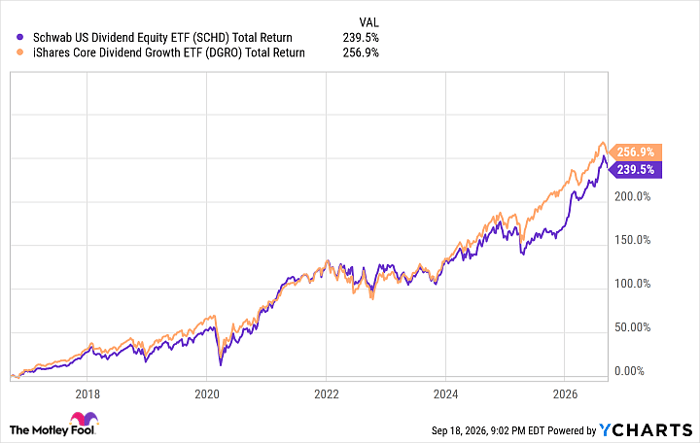
Data by YCharts.
Much of the reason for the iShares fund's success is its above-average weight (16.7%) in tech stocks relative to the broader universe of dividend ETFs. In plain English, it's a nice advantage for a dividend ETF to count Microsoft and Apple among its top 10 holdings, particularly over a decade in which those stocks soared. So while I'm not saying that value investing is dead (it's not), I am comfortable laying the bet that growth will continue leading over the next decade. That's an advantage for the iShares ETF.
Index investigation
Both of these ETFs track indexes with high barriers to entry. The Schwab fund tracks the Dow Jones U.S. Dividend 100 Index, which focuses on high-yield payout growers meeting specific financial requirements. The iShares fund benchmarks to the Morningstar US Dividend Growth Index, which emphasizes dividend growers "with the capacity to sustain that growth."
It's splitting hairs, and investors can find comfort in either index's methodology. Still, by not including yield in the equation, the Morningstar index can emphasize payout growth, which history suggests works in investors' favor relative to high-yield dividend stocks.
Don't get me wrong. The Schwab ETF will have its moments over the next decade, but give me the iShares Core Dividend Growth ETF due to its "growthier" profile.
Should you buy stock in iShares Trust - iShares Core Dividend Growth ETF right now?
Before you buy stock in iShares Trust - iShares Core Dividend Growth ETF, consider this:
The Motley Fool Stock Advisor analyst team just identified what they believe are the 10 best stocks for investors to buy now… and iShares Trust - iShares Core Dividend Growth ETF wasn’t one of them. The 10 stocks that made the cut could produce monster returns in the coming years.
Consider when Netflix made this list on December 17, 2004... if you invested $1,000 at the time of our recommendation, you’d have $395,625!* Or when Nvidia made this list on April 15, 2005... if you invested $1,000 at the time of our recommendation, you’d have $1,397,147!*
Now, it’s worth noting Stock Advisor’s total average return is 951% — a market-crushing outperformance compared to 214% for the S&P 500. Don't miss the latest top 10 list, available with Stock Advisor, and join an investing community built by individual investors for individual investors.
See the 10 stocks »
*Stock Advisor returns as of September 22, 2026.
Todd Shriber has no position in any of the stocks mentioned. The Motley Fool has positions in and recommends Apple and Microsoft. The Motley Fool has a disclosure policy.
Recommended Articles


