


1 Red Flag Apple Investors Can't Afford to Ignore
Key Points
Apple's price-to-earnings ratio has become very high relative to its peers.
Apple's growth rate is accelerating, but it's nowhere close to that of some of its peers.
- 10 stocks we like better than Apple ›
Apple (NASDAQ: AAPL) has been a pretty solid stock pick for 2026, rising nearly 25% so far. That outperforms many well-known artificial intelligence (AI) investments, including Nvidia (NASDAQ: NVDA).
However, I think there is a red flag that Apple investors cannot afford to ignore. If you choose to ignore it, the consequences could prove disastrous for your portfolio.
Missed AI’s "Act 1"? Act 2 Could Be 15x Bigger. Most investors think they missed the AI boat because they didn't buy Nvidia in 2005. But according to our analysts, we’re only at the end of "Act 1"—the R&D phase. "Act 2" is the global rollout. Continue »

Image source: Getty Images.
Apple's valuation has gotten out of control
Normally, a company's stock performance is tied to its business performance. However, other factors, such as how much an investor is willing to pay for a stock, also play a role. A stock's valuation multiple reflects how bullish or bearish the market is on the stock. Still, sometimes the stock and the business can become decoupled due to valuation discrepancies. I think Apple is dangerously close to crossing that line.
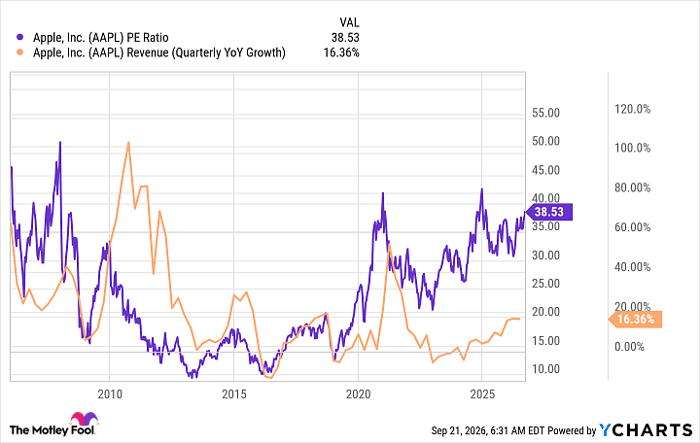
Over the past two decades, Apple has traded at over 40 times earnings three times. The first was in the mid-2000s, but that quickly came crashing down during the financial crisis. The second was in 2021, when Apple was benefiting significantly from consumers spending more on electronics due to COVID-19 lockdowns. The last time was at the end of 2025, and the valuation promptly crashed after that.
Data by YCharts.
Apple looks set to cross that valuation threshold once again. Still, even though its growth rate has accelerated in recent quarters, it doesn't appear to be enough to justify its valuation. A price-to-earnings ratio of 40 is a very high price to pay for a stock, especially at a 16% growth rate. Compared to some of its peers, this looks incredibly expensive.
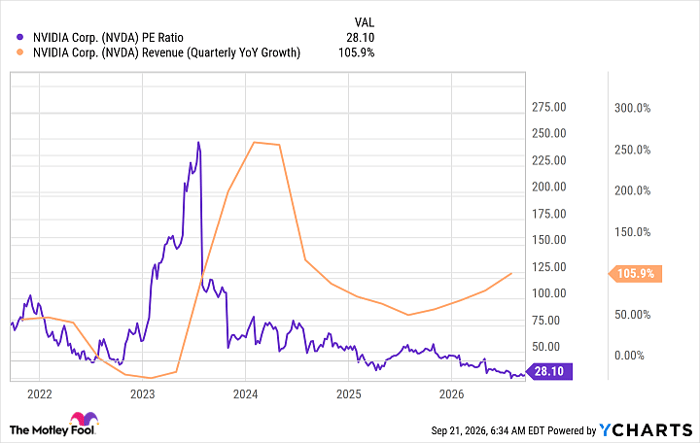
Currently, Apple is the second-largest company in the world, behind Nvidia. However, Nvidia trades at a much lower price despite growing at a much faster rate.
Data by YCharts.
There are several other big tech stocks that would trade in the high-20s times earnings if one-time gains didn't skew their valuation metrics, and I think that's exactly where Apple should trade. There's nothing Apple is doing that makes it worth that much more than its peers, and the stock could correct to a reasonable valuation or stay flat while Apple grows into its high price tag.
Regardless of which one happens, Apple is a precarious stock to invest in, and I think there are far better options for your investment dollars out there.
Should you buy stock in Apple right now?
Before you buy stock in Apple, consider this:
The Motley Fool Stock Advisor analyst team just identified what they believe are the 10 best stocks for investors to buy now… and Apple wasn’t one of them. The 10 stocks that made the cut could produce monster returns in the coming years.
Consider when Netflix made this list on December 17, 2004... if you invested $1,000 at the time of our recommendation, you’d have $395,625!* Or when Nvidia made this list on April 15, 2005... if you invested $1,000 at the time of our recommendation, you’d have $1,397,147!*
Now, it’s worth noting Stock Advisor’s total average return is 951% — a market-crushing outperformance compared to 214% for the S&P 500. Don't miss the latest top 10 list, available with Stock Advisor, and join an investing community built by individual investors for individual investors.
See the 10 stocks »
*Stock Advisor returns as of September 22, 2026.
Keithen Drury has positions in Nvidia. The Motley Fool has positions in and recommends Apple and Nvidia. The Motley Fool has a disclosure policy.
Recommended Articles


