


Arm Stock Forecast: ARM Breaks $299 as Agentic AI Re-Rates the CPU Story
TradingKey - Arm Holdings (ARM) finished up 17.16% at $322.90 on Monday following a break above a descending trendline and the $299.41 resistance. Investors have become more bullish on the semiconductor industry after price appreciation of GPUs and CPUs due to advances in Generative Artificial Intelligence (AI). This is because Generative AI, similar to machine learning, increases the usage of central processing units (CPUs). While Arm Holdings has exposure through its traditional business model of charging royalties for semiconductor designs and the CPU business, the rally has resulted in overvalued and overbought conditions.
Meta's Muse Reignites the CPU AI Trade
Rallying Arm Holdings on Monday, was the rapid adoption of Meta’s AI agent, Muse, which was released on September 8. Arm Holdings’ shares jumped over 17% on the day along with double digit gains in Intel and Advanced Micro Devices, Inc. (AMD). The rise of AI agents to process and retrieve data requires semiconductor chips and creates a substantial increase in CPU demand.
This is important for Arm because its architecture already spans a number of data center CPU platforms. So, the rally shows that use cases for agentic AI are likely to be found in infrastructure beyond GPUs.
AGI CPU Is Arm's Biggest Strategic Shift
Arm moving downstream to design and deliver production silicon represents a major shift for the company. Traditionally, Arm has relied on a strong IP model where the company would license its IP to fabless customers. With AGI CPUs, Arm is shifting to a model where it sells Arm-designed silicon products.
With respect to future revenue, customer demand for Arm AGI CPU now exceeds $2 billion across fiscal 2027 and fiscal 2028. The company has also delivered initial products to multiple customers, and has also expanded its customer base to both the U.S. and China.
What is not clear is how much of that demand Arm is able to fulfill. The company believes that it has the manufacturing capacity to fulfill $1 billion of that demand.
I am interested to see how Arm will manage its new, more integrated, product offering and the supply chain risks associated with it. Traditionally, Arm relied on a more capital light business model.
Data-Center Royalties Are Already Accelerating
Total revenues grew to $1.29 billion in Q1, a 22% increase over the prior year. The royalty business contributed $715 million, or 22% growth, and the license business contributed $574 million, or 23% growth.
Adjusted operating margins increased to 41.2% from the prior year’s 39.1%, while data-center royalties more than doubled year over year.
As of this quarter’s report, Arm noted more than 1.5 billion Neoverse cores shipped, with 500 million cores shipped in the most recent nine months.
Neoverse CSS N4 Expands the Opportunity
On September 8, Arm announced the Neoverse CSS N4 Data Center Compute Subsystem. Like its predecessors, N4 gives Arm’s customers the ability to fabricate chips based on Arm’s IP. N4, however, can support up to 128 cores per chip.
It lies in between traditional licensing and full AGI chips. Because of this, Arm can charge more for each CPU core and gives its customers more flexibility.
The strategy has given Arm three distinct revenue streams that form the basis of its investment thesis: IP licensing, Compute Subsystems and Full Chips.
Mobile Remains the Weak Spot
Because Arm relies most heavily on the mobile chip market of all its markets, this is typically considered the most risky part of Arm’s business. Management guided to about 13% overall royalty growth in Q2, while warning that smartphone royalties would remain soft because higher memory prices are pressuring handset shipments.
Because smartphone shipments are under pressure, Arm is attempting to increase the average royalty unit by driving adoption of newer architectures and Compute Subsystems. CSS for mobile 2 integrates AI and improved graphics; however, the Mobile 2 platform is designed for AI-native smartphones rather than data-center workloads.
Q2 Guidance Is Strong, but Valuation Is Demanding
Arm has provided preliminary guidance for Q2 with revenue of approx. $1.38 billion, plus or minus $50 million, and adjusted EPS of $0.47, plus or minus $0.04. Arm has an investor date calendar that shows Nov. 4 as the tentatively proposed date for their Q2 earnings release.
Valuation is the largest risk factor for Arm at these levels. The stock is trading at approximately 135x forward earnings and 67x trailing sales.
I’ll consider Arm the next report. For Arm to warrant this valuation, they must deliver additional evidence of progress for each of the following: 1) continued expansion of data center royalty revenue, 2) meaningful units shipments of Arm CPUs, and 3) further investment in/expansion of manufacturing capacity. Until they provide evidence for each of these, the valuation is unsupported.
Arm Technical Analysis: ARM Breaks $299.41 as Rally Targets $345
As of writing, Arm Holdings (ARM) is trading at approximately $322.80, aligned with the previous close at $322.90. The 2-hour time frame chart shows an uptrend after price broke above the resistance at the $299.41 and the descending trend line. Additionally, price broke the 1.272 Fibonacci extension at $319.41 and is currently trading above the extension.
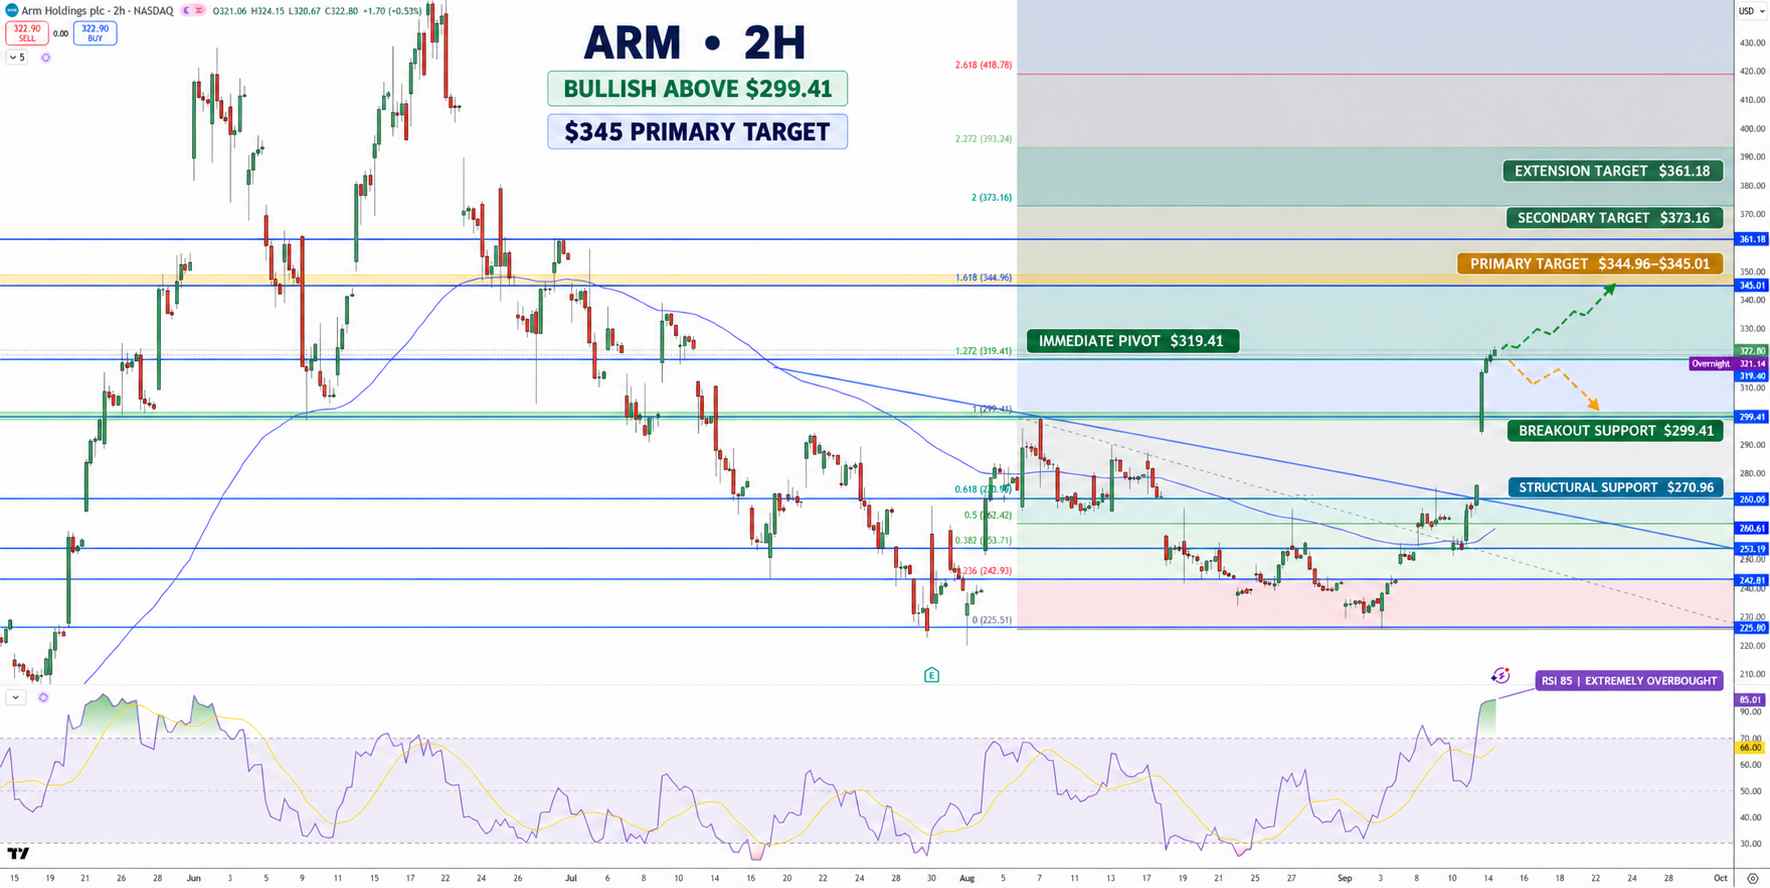
Arm Stock Price Chart - Source: Tradingview
The Relative Strength Index (RSI) is at 85 indicating firmly overbought conditions. Traders should consider taking a counter position, or at the very least, taking profits on long positions.
Currently, the focus should be on the 1.618 Fibonacci extension at $344.96. If price breaks above this level, the extension moves to $361.18 and $373.16.
If the price is rejected from the $344.96 to $345.01 resistance area, the first downside pivots would be $319.41 and then $299.41. If price breaks $299.41, there would be a focus on $270.96.
Overall, the focus should be on the upside to $344.96 to $345.01, and a trading range from $319.41 to $299.41. The RSI at 85 indicates that pullback and consolidation risk is elevated before or around the $344.96 to $345.01 area.
Why is Arm stock in focus now?
Recent reports focus on Arm due to the growing demand for CPUs to process agentic AI in data centers. Arm has more than $2 billion of customer demand for its AGI CPUs across fiscal 2027 and fiscal 2028. This year, Arm has more than doubled its data center royalties and increased its investments in CPUs.
What level confirms a stronger ARM breakout?
If Arm's stock can break through the $344.96 to $345.01 level, that would indicate bullish sentiment and an increased chance of a move to the $361.18 level and possibly the $373.16 level. A move below the $299.41 level would be bearish.
Bottom Line
Arm will need to show strong growth to justify its current valuation. The business is expected to benefit from ongoing trend of expanding and upgrading data centers. The current setup provides substantial growth potential, but returns will depend on execution and whether Arm can convert its AGI CPU demand pipeline into revenue. From a technical analysis perspective, Arm is expected to remain in an uptrend as long as it doesn’t closes below $299.41. A move above $344.96 to $345.01 would confirm the uptrend and increase the likelihood of a move toward $361.18. A drop below $299.41 would be a stronger-than-expected move lower.
Recommended Articles


