


Where Will QQQ Be in 20 Years? Here's What the Nasdaq-100's Historical Growth Rate Suggests.
Key Points
The Invesco QQQ Trust is one of the easiest ways to invest in the tech-heavy Nasdaq-100 index.
Based on a wide range of historical growth rates, $10,000 invested in QQQ today could grow to as little as $77,000 or nearly $440,000 over the next 20 years.
- 10 stocks we like better than Invesco QQQ Trust ›
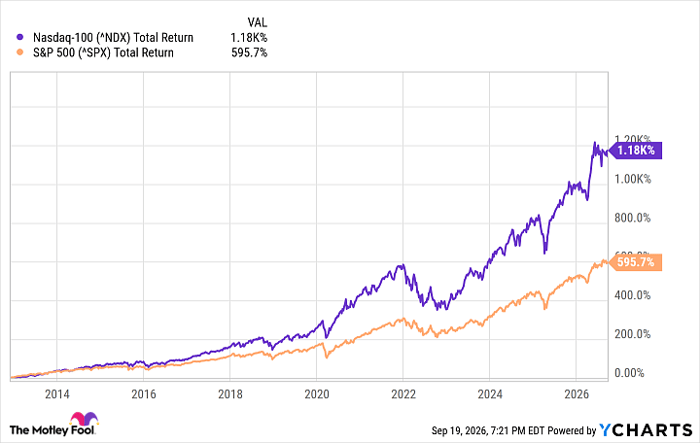
For most of the past 20 years, buying tech stocks has been one of the smartest moves for investors. Ever since September 2006, the tech-heavy Nasdaq-100 index has strongly outperformed the S&P 500 index (SNPINDEX: ^GSPC).
Missed AI’s "Act 1"? Act 2 Could Be 15x Bigger. Most investors think they missed the AI boat because they didn't buy Nvidia in 2005. But according to our analysts, we’re only at the end of "Act 1"—the R&D phase. "Act 2" is the global rollout. Continue »
^NDX data by YCharts
One of the easiest, low-cost ways to buy fast-growing tech stocks is to buy the Invesco QQQ Trust (NASDAQ: QQQ), a popular tech ETF that tracks the Nasdaq-100 and is known for short as "the Qs." In the past 10 years, QQQ has delivered average annual returns of about 20.8%.
But can that strong performance continue? Recent Vanguard research forecasts that over the next 10 years and 30 years, U.S. growth stocks (like the companies owned by QQQ) will underperform value stocks and some international stocks. Tech stocks aren't guaranteed to be the biggest winners forever.
Let's look at how a $10,000 investment in QQQ could grow in the next 20 years based on historical data.

Image source: Getty Images.
QQQ in 20 years: Based on strong recent returns
Past performance does not guarantee future results. But let's assume that this Nasdaq-100 ETF can keep delivering the same strong rate of return that it's delivered for the past 10 years (20.8%) for the next 20 years.
If you invested $10,000 in the Invesco QQQ Trust ETF today, and it delivered annualized returns of 20.8%, after five years, your investment would grow to $25,724. After 10 years, you'd have $66,171. And after 20 years, you'd have $437,863.
QQQ in 20 years: Based on long-term average returns
But what if the next 20 years aren't as good for tech stocks as the past 10 years have been? Keep in mind that tech stocks can be risky and volatile. They sometimes go through massive sell-offs that last for years. The Invesco QQQ ETF was first offered to investors in March 1999, right before the dot-com bubble burst. If you look at this long-term average, QQQ has delivered average annual returns of about 10.8% over the past 27 years since the fund's inception.
That's a more modest return than the past 10 years, but still enough to earn big gains. If you invest $10,000 today in QQQ and the tech ETF delivers 10.8% annualized returns, after 20 years, you'd have $77,767.
Should you buy stock in Invesco QQQ Trust right now?
Before you buy stock in Invesco QQQ Trust, consider this:
The Motley Fool Stock Advisor analyst team just identified what they believe are the 10 best stocks for investors to buy now… and Invesco QQQ Trust wasn’t one of them. The 10 stocks that made the cut could produce monster returns in the coming years.
Consider when Netflix made this list on December 17, 2004... if you invested $1,000 at the time of our recommendation, you’d have $387,158!* Or when Nvidia made this list on April 15, 2005... if you invested $1,000 at the time of our recommendation, you’d have $1,365,749!*
Now, it’s worth noting Stock Advisor’s total average return is 932% — a market-crushing outperformance compared to 211% for the S&P 500. Don't miss the latest top 10 list, available with Stock Advisor, and join an investing community built by individual investors for individual investors.
See the 10 stocks »
*Stock Advisor returns as of September 22, 2026.
Ben Gran has no position in any of the stocks mentioned. The Motley Fool has no position in any of the stocks mentioned. The Motley Fool has a disclosure policy.
Recommended Articles


