


What History Says About Owning Berkshire Hathaway Through a Recession
Key Points
Berkshire Hathaway is much more than a collection of high-quality stocks.
Even in challenging economic times, the conglomerate’s wholly-owned businesses remain capable of generating reliable cash.
From a risk-minimization perspective, Berkshire is a better bet than most other stocks.
- 10 stocks we like better than Berkshire Hathaway ›
Are you worried enough about rising interest rates jump-starting a recession that you're looking for ways of sidestepping the effect of such an economic headwind? It's not a terrible idea to at least start making a mental plan for that possibility.
You may have considered Berkshire Hathaway (NYSE: BRKA) (NYSE: BRKB) to fill that role. Its wholly owned, private businesses generate plenty of cash flow regardless of the economic backdrop, after all.
Missed AI’s "Act 1"? Act 2 Could Be 15x Bigger. Most investors think they missed the AI boat because they didn't buy Nvidia in 2005. But according to our analysts, we’re only at the end of "Act 1"—the R&D phase. "Act 2" is the global rollout. Continue »
But how do Berkshire shares actually perform during recessions? It's not like the data doesn't exist.
What makes Berkshire Hathaway different?
You probably know Berkshire Hathaway best by its stock picks. Although they're not built to be an actively managed mutual fund, its equity holdings -- and changes to these holdings -- are closely followed by investors looking for some new ideas for their own portfolios.
That's far from all that Berkshire is, though. Indeed, only about one-third of the conglomerate's current market cap of $1.1 trillion reflects the value of its individual stock holdings. More than another third of Berkshire Hathaway's current value is the implied value of the several dozen private enterprises that it wholly owns. These businesses include Shaw flooring, Fruit of the Loom, GEICO insurance, Clayton Homes, Duracell, and Dairy Queen, just to name a few.
These businesses' results are recorded and reported differently as well.
Changes in the value of Berkshire's stock holdings are reported as investment gains and losses every quarter, whether they're realized or unrealized. These changes can be pretty dramatic from one quarter to the next, too, largely reflecting the broad market's ebb and flow. Since they're outright owned, however, the net profits that Berkshire's wholly owned outfits generate in any given quarter are spendable, liquid cash that's added directly to the company's net earnings total. For perspective on this figure, the second quarter's operating earnings were a fairly typical $13 billion.

Image source: Getty Images.
This is what makes Berkshire a seemingly better bet in tough market environments. Stocks may be underperforming because investors are afraid to buy or even hold them. These privately managed cash cows, however, are largely unaffected by economic headwinds.
The question is, does the theory hold up when put to the test?
Sort of.
What history says
The past 30 years have been relatively unusual ones for the economy, and by extension, for the stock market. The United States has only experienced three recessions during this stretch. Although few in quantity, these three were unusually harsh, so much so that not even the most resilient of businesses -- or stocks -- were guaranteed to hold up during these challenging periods.
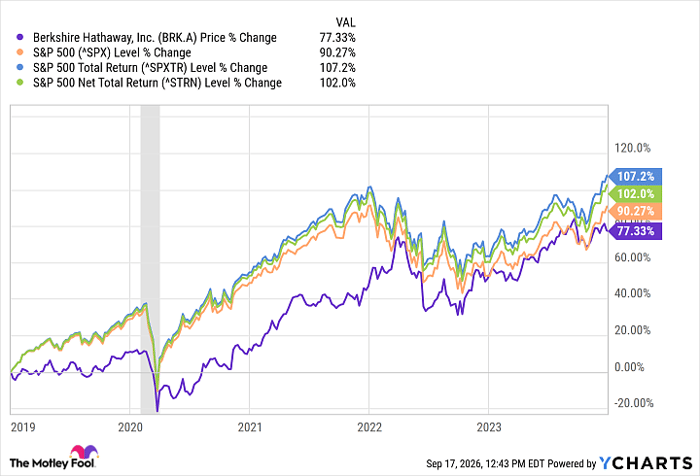
They certainly didn't in early 2020, when the coronavirus was rapidly spreading across the world. As the graphic below illustrates, nothing (including Berkshire) escaped the subsequent fear-driven sell-off.
BRK.A data by YCharts.
It's not exactly a fair look, though. Selling was pretty indiscriminate then. Investors weren't actually thinking about whether or not Berkshire's businesses would continue generating cash flow during that time.
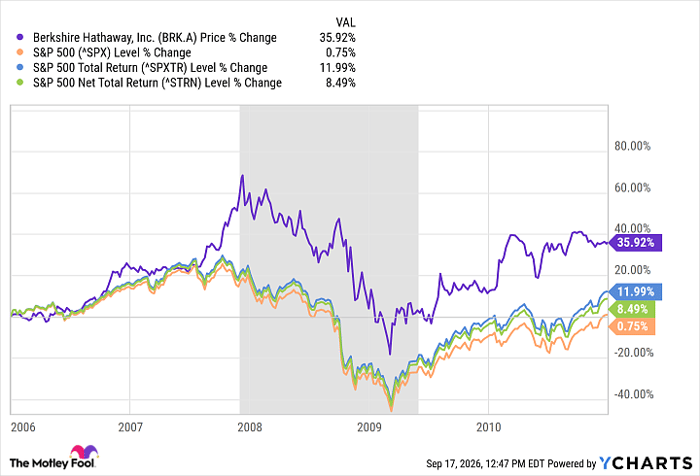
Berkshire Hathaway's stock didn't sidestep 2008's bear market, which was sparked by the meltdown of the subprime mortgage market. This affected much of the rest of the lending market and most real estate businesses.
BRK.A data by YCharts.
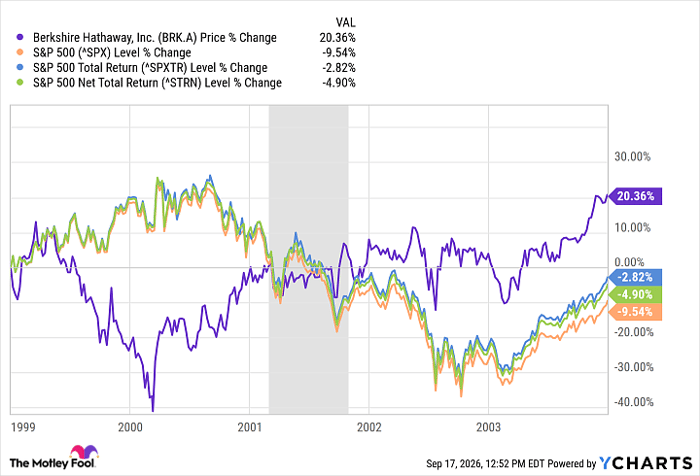
How about early 2000, when the rapid rise of some technology stocks set the stage for a prolonged setback? This is where things get interesting. As the image below highlights, Berkshire Hathaway not only held up during this weakness, but moved in near-perfect opposition to the S&P 500 (SNPINDEX: ^GSPC) between 1999 and 2003, when it finally synced up again with the broad market. (Berkshire's insurance business also suffered significant losses in 1999, adding to its underperformance that year.)
BRK.A data by YCharts.
This makes sense, though. Warren Buffett, who was CEO and chief stock picker at the time, was never a big fan of the tech stocks that were leading the bullish charge of the late 1990s. The fact that Berkshire didn't own any of these names when they began to implode in 2000 suddenly made it a brilliant, must-have defensive holding.
So is it worth owning in a recession or not?
The question remains, of course: If recently rising interest rates flag an eventual-but-inevitable recession, would scooping up a stake in Berkshire Hathaway -- as a defensive holding -- be a wise move to make now? Perhaps, but that's certainly no guarantee, for two reasons.
First, although investors connected the dots in 2000, there's no assurance they'll recognize or remember that this conglomerate owns a bunch of cash-producing businesses capable of shrugging off economic headwinds. If they don't remember this, then Berkshire's stock could sink anyway, simply falling in line with the broad market tide.
Second, given that Alphabet (NASDAQ: GOOG) (NASDAQ: GOOGL) accounts for about one-tenth the value of Berkshire's current stock portfolio worth $360 billion, it's not as if the conglomerate is completely immune to any technology-led sell-off. Although this $36 billion position in Alphabet is only a fraction of Berkshire Hathaway's total value, investors could still unduly punish Berkshire's stock for simply holding this position at all. Indeed, Buffett just stepped down as chair, and CEO Greg Abel will have even freer rein to make portfolio decisions.
Even so, Berkshire Hathaway is still arguably a better name than most others to own during a recession, including a simple alternative like an S&P 500 index fund. Although there's no guarantee it won't also pull back, it's at least got a respectable shot at standing its ground. That's all you can reasonably ask for.
The one thing you don't want to do? That's trying to perfectly time any entry and exit into or out of Berkshire Hathaway shares to coincide with the stock market's peaks and troughs. Given the unlikelihood of successfully identifying the market's highs and lows, that plan could easily make the effect of a recession even worse.
Should you buy stock in Berkshire Hathaway right now?
Before you buy stock in Berkshire Hathaway, consider this:
The Motley Fool Stock Advisor analyst team just identified what they believe are the 10 best stocks for investors to buy now… and Berkshire Hathaway wasn’t one of them. The 10 stocks that made the cut could produce monster returns in the coming years.
Consider when Netflix made this list on December 17, 2004... if you invested $1,000 at the time of our recommendation, you’d have $387,158!* Or when Nvidia made this list on April 15, 2005... if you invested $1,000 at the time of our recommendation, you’d have $1,365,749!*
Now, it’s worth noting Stock Advisor’s total average return is 932% — a market-crushing outperformance compared to 211% for the S&P 500. Don't miss the latest top 10 list, available with Stock Advisor, and join an investing community built by individual investors for individual investors.
See the 10 stocks »
*Stock Advisor returns as of September 19, 2026.
James Brumley has positions in Alphabet. The Motley Fool has positions in and recommends Alphabet and Berkshire Hathaway. The Motley Fool has a disclosure policy.
Recommended Articles


