


Warren Buffett Just Issued a Blunt Message as This Stock Market Warning Rings for the Second Time in 155 Years
Key Points
Warren Buffett built Berkshire Hathaway's portfolio around the idea of holding on to blue chip stocks for decades.
The S&P 500 Shiller CAPE ratio is at its highest level since the dot-com boom and its second-highest reading in 155 years.
Despite a pricey market, investors are best off holding quality businesses through temporary volatility.
- 10 stocks we like better than S&P 500 Index ›
Warren Buffett did not become the face of the stock market by accident. Between 1965 and 2025, Berkshire Hathaway, the company he once led, compounded at about 19.7% a year. The S&P 500 (SNPINDEX: ^GSPC), with dividends included, managed a 10.5% return.
This gap might look moderst on paper, but in terms of absolute dollars, it's enormous. When a person with Buffett's track record talks about the market, it is usually worth putting the phone down and listening.
Missed AI’s "Act 1"? Act 2 Could Be 15x Bigger. Most investors think they missed the AI boat because they didn't buy Nvidia in 2005. But according to our analysts, we’re only at the end of "Act 1"—the R&D phase. "Act 2" is the global rollout. Continue »
During a recent sit-down with CNBC's Becky Quick, Buffett put it bluntly: "It's tough to find values when everybody is preferring gambling." The Oracle of Omaha has been circling the same idea for months, calling the market a church with a casino attached and saying he has never seen people in more of a gambling mood.
Buffett might be right. Prices look stretched, short-term trading is everywhere, and a lot of money is tied up chasing stories instead of businesses.
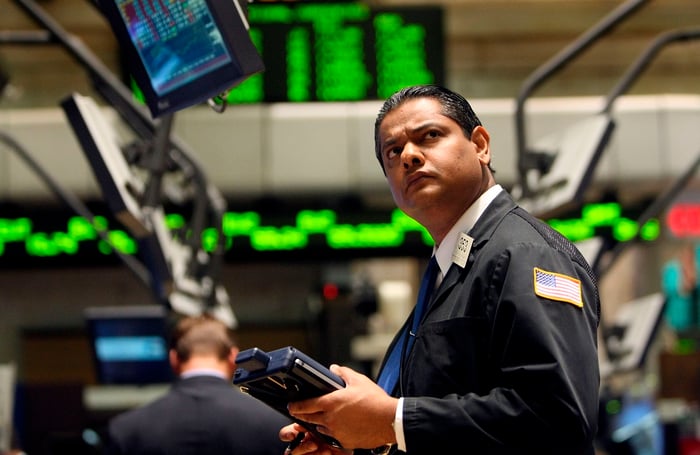
Image source: Getty Images.
How does Warren Buffett think about a business?
Buffett invests in companies that can earn more than they spend for a long time. That is why he spends so much time talking about economic moats and competitive advantages.
A moat is what prevents rivals from stealing customers -- brand, scale, switching costs, or a network that gets stronger as more people use it. These advantages generate durable cash flow that companies can use to pay dividends, buy back stock, or reinvest in the business. Over decades, that compounding does the heavy lifting for your portfolio.
Buffett is also a contrarian by nature. He likes to buy stocks when everyone else is bored or scared, not when the story already dominates every homepage. This is why Berkshire Hathaway stayed relatively shy of the artificial intelligence (AI) trade for so long. The frenzy drove up valuations. It wasn't until about a year ago that Berkshire initiated a position in Alphabet.
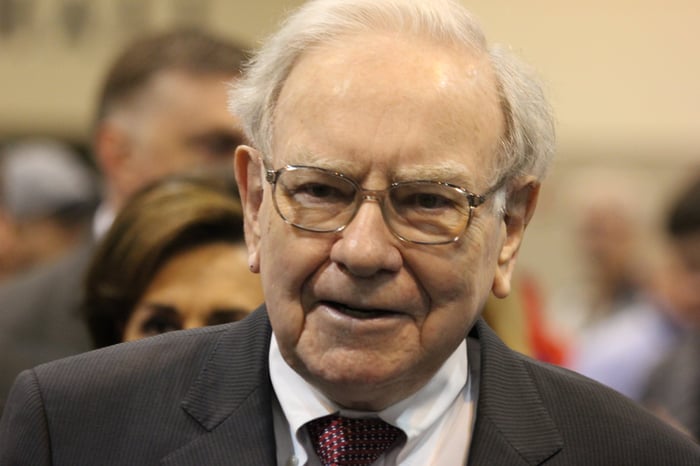
Image source: The Motley Fool.
The CAPE ratio is flashing yellow
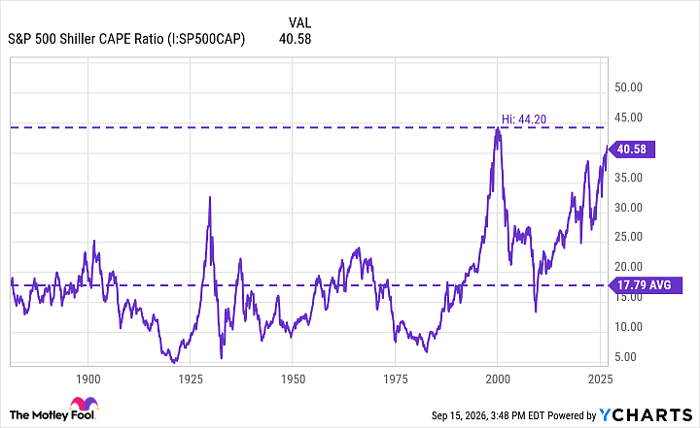
The cyclically adjusted price-to-earnings (CAPE) ratio, or Shiller CAPE ratio, divides the S&P 500's price by 10 years of inflation-adjusted earnings. The idea is to smooth out boom-and-bust profits so investors are not fooled by one great year or a down year.
Using 155 years of stock market data, economists found that the CAPE ratio has averaged 17.8 over the long run. Right now, it sits at about 41. This is well within shouting distance of the all-time high reading of about 44 during the peak of the dot-com bubble in 2000.
S&P 500 Shiller CAPE Ratio data by YCharts
Does this mean the AI revolution is destined to pop, as famous dot-com cautionary tales like Pets.com did? Not necessarily.
In 2000, many internet companies lacked earnings and did not have a concrete path to generate any cash flow. Today, the largest AI giants -- Nvidia, Amazon, Alphabet, Microsoft, Meta Platforms, Broadcom, and Taiwan Semiconductor Manufacturing -- actually print cash, own real infrastructure, and sell everyday products and services people already use.
A high CAPE ratio still matters in the sense that it usually acts as a signal that future returns probably will be more modest in the future. This means the CAPE's current reading could be more of a warning about valuation rather than a countdown to the next crash. Expensive markets can stay expensive for a long time while cheap markets can get cheaper. The CAPE ratio is best used to help discern the next few years rather than the next few weeks.
Stay invested, and don't try to be a hero
So should investors flee the stock market right now? Buffett's most obvious rule says "absolutely not."
Buffett spent decades arguing that market timing is a fool's errand. This means investors should not cash out just because stocks look frothy and then wait around for a crash that may take years to arrive -- or never materialize the way you pictured. The cost of being out of the market on its best days will all add up to more than any temporary losses you might experience during a slump.
The best move is the boring one Buffett practiced for 60 years: Own businesses that can compound through cycles and look for economic moats, quality management teams, and durable cash flow that can be returned to shareholders or reinvested. If you hold on to these positions long enough -- so that a few bad years do not define the overall result -- time will work in your favor just as it did for Buffett.
Should you buy stock in S&P 500 Index right now?
Before you buy stock in S&P 500 Index, consider this:
The Motley Fool Stock Advisor analyst team just identified what they believe are the 10 best stocks for investors to buy now… and S&P 500 Index wasn’t one of them. The 10 stocks that made the cut could produce monster returns in the coming years.
Consider when Netflix made this list on December 17, 2004... if you invested $1,000 at the time of our recommendation, you’d have $412,074!* Or when Nvidia made this list on April 15, 2005... if you invested $1,000 at the time of our recommendation, you’d have $1,314,319!*
Now, it’s worth noting Stock Advisor’s total average return is 932% — a market-crushing outperformance compared to 209% for the S&P 500. Don't miss the latest top 10 list, available with Stock Advisor, and join an investing community built by individual investors for individual investors.
See the 10 stocks »
*Stock Advisor returns as of September 18, 2026.
Adam Spatacco has positions in Alphabet, Amazon, Microsoft, and Nvidia. The Motley Fool has positions in and recommends Alphabet, Amazon, Berkshire Hathaway, Broadcom, Meta Platforms, Microsoft, Nvidia, and Taiwan Semiconductor Manufacturing. The Motley Fool has a disclosure policy.
Recommended Articles


