


Stock Market Sell-Off: Is It Really Safe to Invest Right Now? Here's What History Says.
Key Points
War, inflation, and rising Treasury yields have been testing the S&P 500 lately.
Sell-offs, corrections, and bear markets are nothing extraordinary and happen more than investors may think.
The market's best days often occur during a bear market or at the start of a bull market.
- 10 stocks we like better than S&P 500 Index ›
September has historically been the S&P 500's (SNPINDEX: ^GSPC) weakest month, and this year's looks no different. As of this writing on Sept. 15, the S&P 500 is down over 100 points since the start of the month, a roughly 1.3% decline.
The market index has still been up over 15% since last September and has notched an 11% gain since the start of 2026. Still, something seems to be stirring investors' fears, whether it's war, inflation, or rising Treasury yields.
Missed AI’s "Act 1"? Act 2 Could Be 15x Bigger. Most investors think they missed the AI boat because they didn't buy Nvidia in 2005. But according to our analysts, we’re only at the end of "Act 1"—the R&D phase. "Act 2" is the global rollout. Continue »
Amid this uncertain background, is it really safe to invest in the market right now? For most investors, history offers a surprisingly clear answer: Waiting for the turbulence to end might be riskier than investing through it. Here's what that means.
Drawbacks, corrections, and bear markets are nothing new
Stock sell-offs are part of investing; in the grand scheme of things, they are common and routine. Many experienced investors have come to expect them; they know that a pullback can feel urgently bad in the moment. At the same time, they also know that a sell-off is usually brief compared to the decades over which their investments are meant to compound.
The S&P 500, for example, has experienced at least 60 drawdowns of 5% or more since 1957, according to a Reuters analysis of data from Yardeni Research. Within that same period, 22 reached 10%, and 10 declined at least 20%. A $10,000 investment from 1957 until today, however, would have grown to $1.6 million.
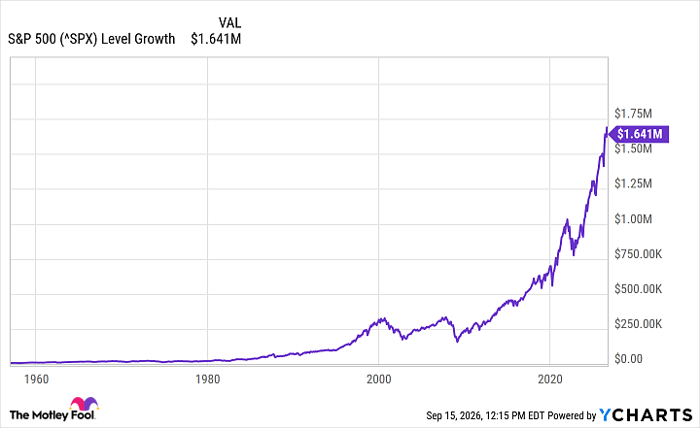
Data by YCharts
Since 1929, the S&P 500 has experienced 56 market corrections, with 22 of those eventually becoming bear markets. The average correction declined about 14% and lasted about 115 days. Still, since 1928, the average annual return of the S&P 500 has been roughly 10%.

Image source: Getty Images.
Staying invested is likely the best course of action
It might seem counterintuitive, but the best thing to do right now is probably nothing.
I say "probably" because not every investor is in the same boat. Money that's needed soon, for instance, probably shouldn't be tied up in stocks. Likewise, a portfolio heavily weighted toward one sector, like tech, could use some diversification to become less exposed if that one sector takes a hit.
On the other hand, if you're invested in the S&P 500 and won't need that money for at least several years, you should probably leave it where it is. Selling now with the hope of buying low before the next bull market may seem smart, but it rarely works out the way you expect. Indeed, as research from Hartford Funds points out, around three-quarters of the market's best days occur during bear markets, or within two months of a new bull market.
That last point highlights the (potentially) frustrating thing about sell-offs: They're often over before investors feel comfortable that the danger has passed. Instead of trying to time the market, it's best to maintain a disciplined investing plan. History favors that approach.
Should you buy stock in S&P 500 Index right now?
Before you buy stock in S&P 500 Index, consider this:
The Motley Fool Stock Advisor analyst team just identified what they believe are the 10 best stocks for investors to buy now… and S&P 500 Index wasn’t one of them. The 10 stocks that made the cut could produce monster returns in the coming years.
Consider when Netflix made this list on December 17, 2004... if you invested $1,000 at the time of our recommendation, you’d have $412,074!* Or when Nvidia made this list on April 15, 2005... if you invested $1,000 at the time of our recommendation, you’d have $1,314,319!*
Now, it’s worth noting Stock Advisor’s total average return is 935% — a market-crushing outperformance compared to 210% for the S&P 500. Don't miss the latest top 10 list, available with Stock Advisor, and join an investing community built by individual investors for individual investors.
See the 10 stocks »
*Stock Advisor returns as of September 17, 2026.
Steven Porrello has no position in any of the stocks mentioned. The Motley Fool has no position in any of the stocks mentioned. The Motley Fool has a disclosure policy.
Recommended Articles


