

Nokia Stock Forecast: Tumbles 13% Below $10 Mark Again, Is the Rebound Rally Over?

Source Tradingkey

TradingKey - Nokia Plummets Over 13%, Dropping Below $10 Again: Has the Current Rally Ended?

On September 15 Eastern Time, Nokia (NOK)'s rebound hit a wall as its stock price plunged 13.3% on the New York Stock Exchange, falling below the $10 mark again to close at $9.65. During overnight trading, Nokia's stock price rebounded slightly, but by less than 1%, remaining suppressed below $10.

Nokia's sharp stock price drop this time was not driven by intrinsic factors, but largely by external reasons, mainly including: 1. Industry leaders collectively expressing intent to slow AI development, with industry giants such as Anthropic CEO Dario Amodei, OpenAI CEO Sam Altman, and xAI CEO Elon Musk agreeing to slow model development; 2. Tightening regulatory signals: The U.S. Senate pushing for AI safety legislation; 3. Pressure on macroeconomic liquidity: Rate hike expectations heating up ahead of the FOMC policy meeting.

Under the weight of these three major headwinds, U.S. tech stocks, especially the AI hardware and semiconductor sectors, suffered a sharp single-day selloff yesterday. The Philadelphia Semiconductor Index (SOX) plunged nearly 6%, while core AI stocks such as Nvidia (NVDA), Micron (MU), AMD (AMD), and Broadcom (AVGO) generally fell 3% to 5%, dragging Nokia's stock price lower.

In late July, Nokia's stock price plummeted from its peak to a low of $8.4, resulting in a maximum drawdown of over 50%. Subsequently, Nokia's stock price staged an oversold rebound, climbing toward $11 multiple times without breaking through, while also holding above the defensive support line at $9.5. Over the past month, Nokia's stock price has fluctuated within the $9.5–$11 range.

Now, industry and regulatory headwinds have pushed Nokia's stock price down once again toward technical support at $9. Over the next two days, the Federal Reserve will announce its interest rate decision. If it continues to hold rates steady or even raises rates, Nokia's stock price will likely continue downward and break below this level, potentially testing the July low of $8.4 again or even setting a new low in the short term, which would signal the end of this rally. Of course, if the Fed unexpectedly cuts rates, a surge in liquidity would benefit risk assets, and Nokia's stock price could maintain its upward momentum and strengthen further.
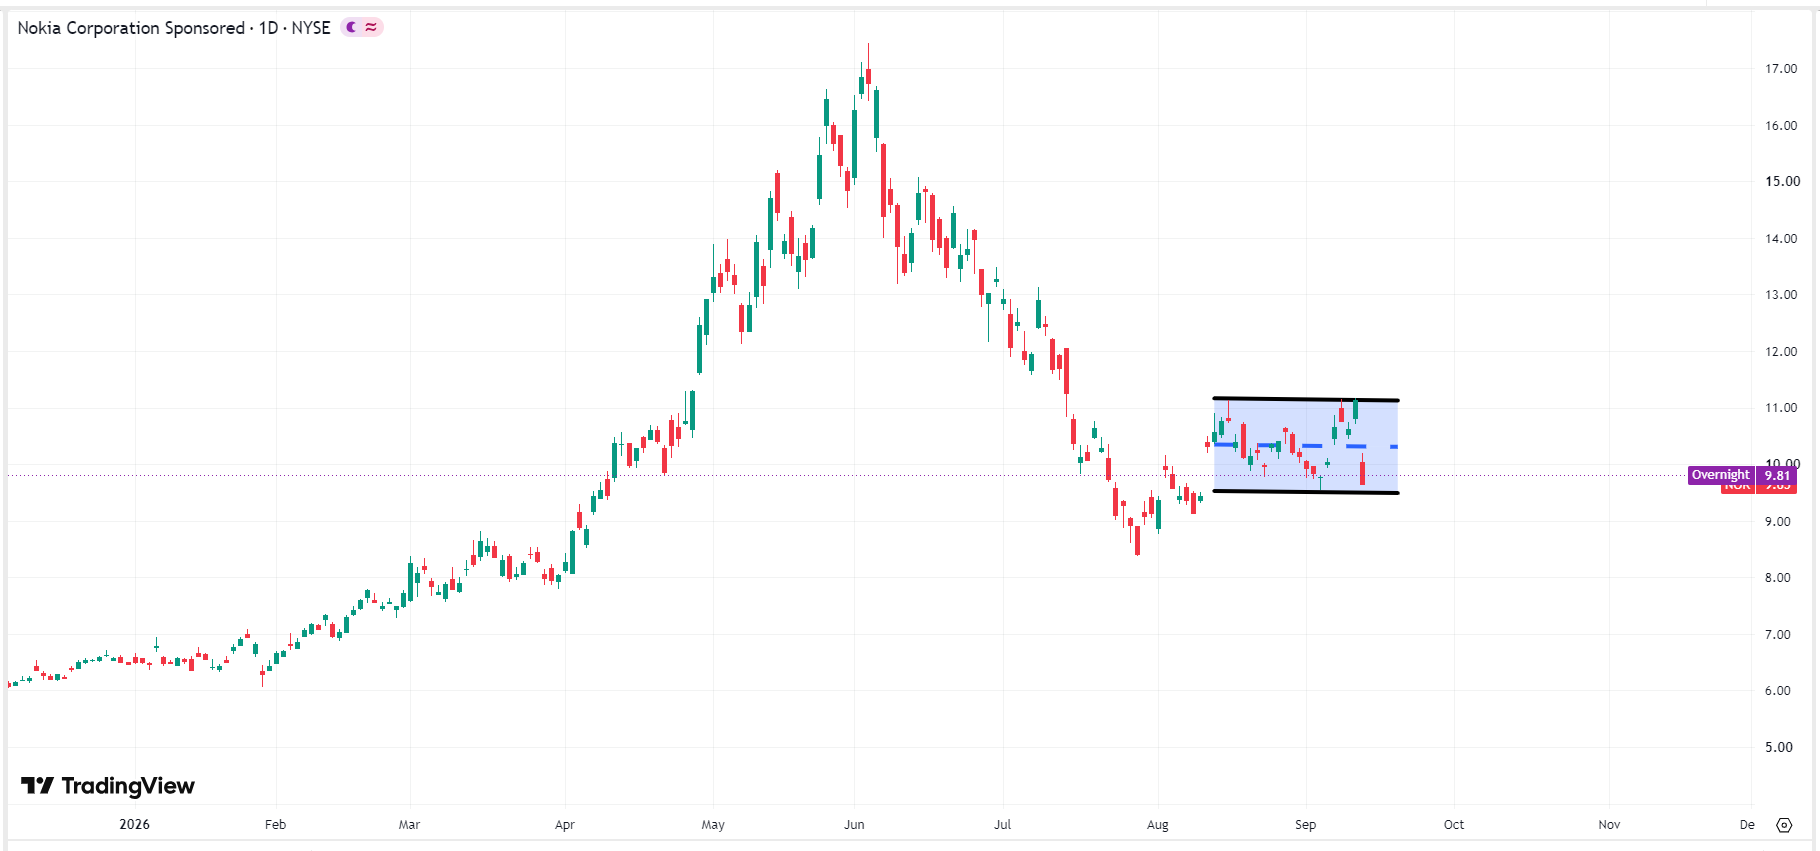
nokia-nok-price-01ec9753abf9458a9375665a345cbcbdNokia stock price chart, Source: TradingView

Disclaimer: For information purposes only. Past performance is not indicative of future results.
placeholder
XRP Price Prediction for July 2026: Can Buyers Finally Break the Downtrend?XRP (XRP) price trades near $1.05, caught between a year-long downtrend and a sudden burst of buying.July has historically rewarded XRP holders. This year the month arrives with on-chain accumulation
Author  Beincrypto
Jun 30, Tue
XRP (XRP) price trades near $1.05, caught between a year-long downtrend and a sudden burst of buying.July has historically rewarded XRP holders. This year the month arrives with on-chain accumulation
placeholder
What to Expect From Ethereum (ETH) in July 2026Ethereum (ETH) enters July 2026 trading near $1,570, close to multi-month lows, after recording its first run of three consecutive red quarterly candles in its history.On-chain data and price charts n
Author  Beincrypto
Jul 01, Wed
Ethereum (ETH) enters July 2026 trading near $1,570, close to multi-month lows, after recording its first run of three consecutive red quarterly candles in its history.On-chain data and price charts n
placeholder
Intel Price Forecast: Nvidia Picked Xeon 6, Invested $5B, Yet Analysts Still Trail INTCIntel Corporation (NASDAQ: INTC) sits at $140.05, holding firm on the ascending trendline within the 2H timeframe. The RSI indicator is currently reading 55.21, positioning it as neutral-
Author  TradingKey
Jul 02, Thu
Intel Corporation (NASDAQ: INTC) sits at $140.05, holding firm on the ascending trendline within the 2H timeframe. The RSI indicator is currently reading 55.21, positioning it as neutral-
placeholder
Gold Price Analysis Today: Gold Drops 1.32% Despite Lower Fed Rate-Hike Bets, Can $4,313 Support Hold? Gold fell 1.32% on August 13 after rising to $4,449.73, then reversing lower and closing near $4,349.918 below the $4,356.46 support. Softer US inflation data reduced Fed rate hike expectations, but selling pressure still dominated the session. Will $4,313 support hold?
Author  Naoufal Seddik
Aug 14, Fri
Gold fell 1.32% on August 13 after rising to $4,449.73, then reversing lower and closing near $4,349.918 below the $4,356.46 support. Softer US inflation data reduced Fed rate hike expectations, but selling pressure still dominated the session. Will $4,313 support hold?
placeholder
Gold Price Analysis Today: Gold Gains 0.94% as Markets Expect Fed to Hold Rates, Can $4,449 Resistance Break? Gold gained 0.94% on August 17, closing near $4,417.30 as softer US data strengthened expectations for unchanged Fed rates in September. Gold remains bullish, with $4,449.730 resistance and $4,310.650 support in focus.
Author  Naoufal Seddik
Aug 18, Tue
Gold gained 0.94% on August 17, closing near $4,417.30 as softer US data strengthened expectations for unchanged Fed rates in September. Gold remains bullish, with $4,449.730 resistance and $4,310.650 support in focus.
goTop
quote