

Pi Network Price Forecast: PI gains bullish strength amid positional buildup

Source Fxstreet
  • Pi Network edges lower on Tuesday, maintaining its marginally upward directional trend above the 50-day EMA at $0.09470.
  • Pi futures Open Interest holds firm at nearly $10 million, reflecting a steady buildup in positions.
  • The technical outlook for PI is bullish, with indicators pointing to improved upside momentum and bulls eyeing a $0.10 breakout.

Pi Network (PI) edges lower on Tuesday, capped below the $0.10 threshold despite two consecutive bullish weekly closings. Retail demand for the PI token remains firm, with futures Open Interest holding steady at around $10 million. The technical outlook for PI indicates a bullish bias as upside momentum improves. 

Retail outlook remains optimistic

Pi Network’s retail strength holds firm as the broader crypto market maintains a broadly bullish bias ahead of the CLARITY Act cloture vote on Tuesday. CoinAnk data shows the PI futures Open Interest (OI) is at $9.89 million, up from $8.98 million on Friday, signaling an increase in the notional value of existing contracts or a positional buildup. 

In the case of Pi Network, a positional buildup would suggest a tentative return to risk-on positioning among traders. 
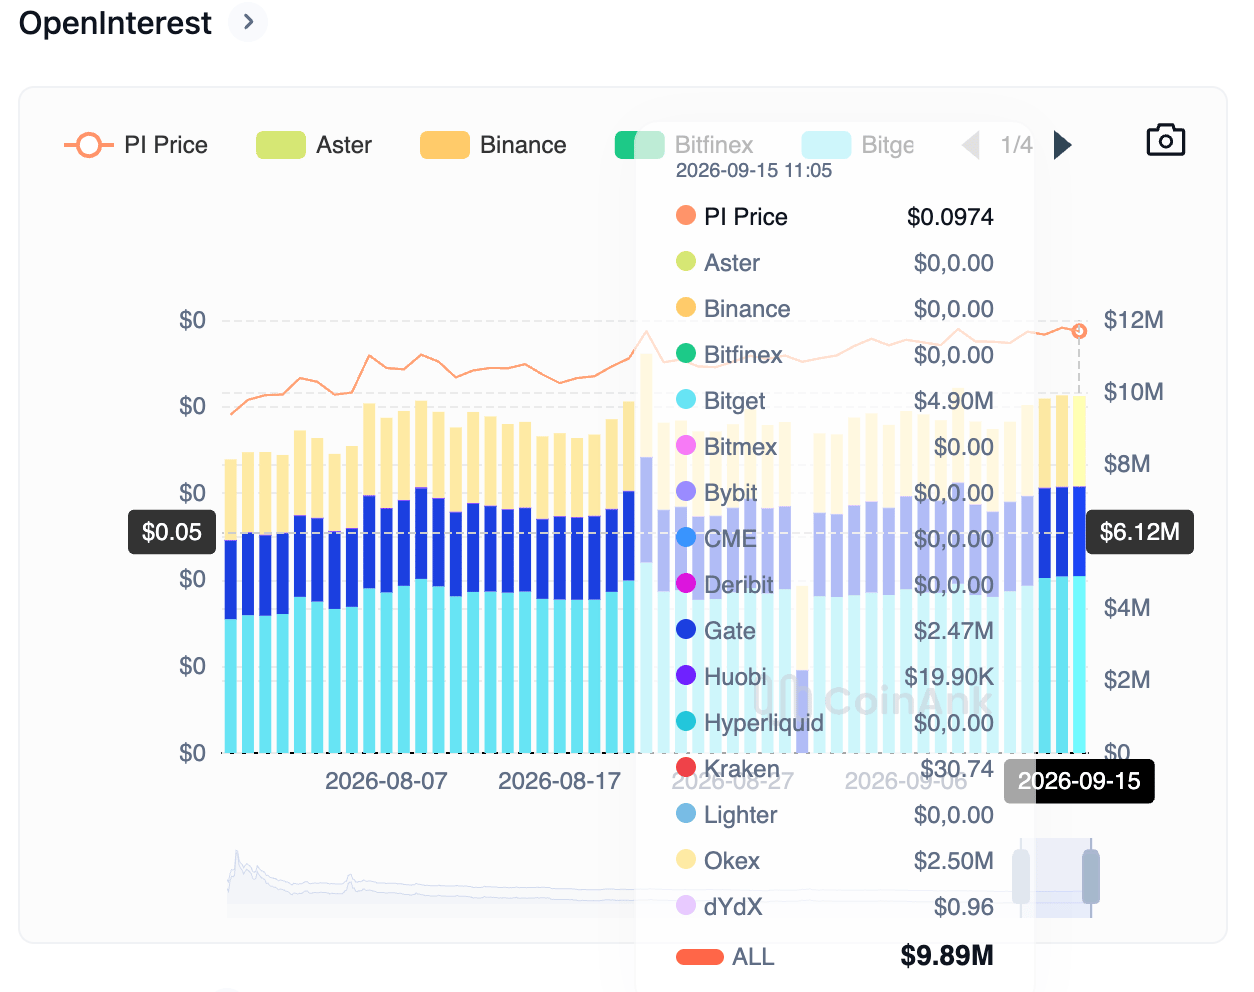
PI token Open Interest chart. Source: CoinAnk

Technical outlook: Pi Network’s slow movement eyes $0.10 breakout

Pi Network trades around $0.0970 at press time on Tuesday, maintaining a near-term constructive tone above its 50-day Exponential Moving Average (EMA) at $0.0947. PI token also holds above the 50% retracement level of the $0.1341-$0.0704 downswing, at $0.0971, reaffirming the near-term recovery.

Still, price remains capped below the 100-day EMA at roughly $0.1051, which serves as the immediate resistance. A confirmed breakout above $0.1051 could target the 78.6% Fibonacci retracement level at $0.1168, followed by the $0.1341 swing high.

The Relative Strength Index (RSI) at about 59 on the daily chart hovers above the midline, suggesting steady upside pressure. Meanwhile, the Moving Average Convergence Divergence (MACD) and its signal line are marginally above the zero line with a positive slope, hinting at gradually improving upside momentum.

Chart Analysis PI/USD (baha Crypto)
PI/USDT daily price chart.

On the downside, immediate support emerges at the 50-day EMA near $0.0947, followed by the 23.6% Fibonacci retracement near $0.0819 and the $0.0704 swing low if selling pressure deepens.

(The technical analysis of this story was written with the help of an AI tool. Know more.)

Disclaimer: For information purposes only. Past performance is not indicative of future results.
placeholder
XRP Price Prediction for July 2026: Can Buyers Finally Break the Downtrend?XRP (XRP) price trades near $1.05, caught between a year-long downtrend and a sudden burst of buying.July has historically rewarded XRP holders. This year the month arrives with on-chain accumulation
Author  Beincrypto
Jun 30, Tue
XRP (XRP) price trades near $1.05, caught between a year-long downtrend and a sudden burst of buying.July has historically rewarded XRP holders. This year the month arrives with on-chain accumulation
placeholder
What to Expect From Ethereum (ETH) in July 2026Ethereum (ETH) enters July 2026 trading near $1,570, close to multi-month lows, after recording its first run of three consecutive red quarterly candles in its history.On-chain data and price charts n
Author  Beincrypto
Jul 01, Wed
Ethereum (ETH) enters July 2026 trading near $1,570, close to multi-month lows, after recording its first run of three consecutive red quarterly candles in its history.On-chain data and price charts n
placeholder
Intel Price Forecast: Nvidia Picked Xeon 6, Invested $5B, Yet Analysts Still Trail INTCIntel Corporation (NASDAQ: INTC) sits at $140.05, holding firm on the ascending trendline within the 2H timeframe. The RSI indicator is currently reading 55.21, positioning it as neutral-
Author  TradingKey
Jul 02, Thu
Intel Corporation (NASDAQ: INTC) sits at $140.05, holding firm on the ascending trendline within the 2H timeframe. The RSI indicator is currently reading 55.21, positioning it as neutral-
placeholder
Gold Price Analysis Today: Gold Drops 1.32% Despite Lower Fed Rate-Hike Bets, Can $4,313 Support Hold? Gold fell 1.32% on August 13 after rising to $4,449.73, then reversing lower and closing near $4,349.918 below the $4,356.46 support. Softer US inflation data reduced Fed rate hike expectations, but selling pressure still dominated the session. Will $4,313 support hold?
Author  Naoufal Seddik
Aug 14, Fri
Gold fell 1.32% on August 13 after rising to $4,449.73, then reversing lower and closing near $4,349.918 below the $4,356.46 support. Softer US inflation data reduced Fed rate hike expectations, but selling pressure still dominated the session. Will $4,313 support hold?
placeholder
Gold Price Analysis Today: Gold Gains 0.94% as Markets Expect Fed to Hold Rates, Can $4,449 Resistance Break? Gold gained 0.94% on August 17, closing near $4,417.30 as softer US data strengthened expectations for unchanged Fed rates in September. Gold remains bullish, with $4,449.730 resistance and $4,310.650 support in focus.
Author  Naoufal Seddik
Aug 18, Tue
Gold gained 0.94% on August 17, closing near $4,417.30 as softer US data strengthened expectations for unchanged Fed rates in September. Gold remains bullish, with $4,449.730 resistance and $4,310.650 support in focus.
goTop
quote