


ExxonMobil Stock Breaks $163.80 as Oil Shock and LNG Growth Put $168.60 in Focus
TradingKey - ExxonMobil closed September 11 at $165.99, up 0.46% from the previous close and matching the supplied chart reference. According to the data provided, the stock jumped out of the $163.80 supply zone and is now trading above $163.80, which becomes the first breakout support. Brent is also currently trading towards $107.5, as geopolitical tensions in the region have increased the infrastructure attacks on Saudi Arabia’s Energy assets. Looking at this setup, ExxonMobil’s fundamentals have improved since yesterday, as the company’s LNG and high crude prices are now more important to the company’s bottom line.
Oil Above $107 Is the Immediate Earnings Tailwind
Brent traded up close to 3% towards $107.5 as renewed attacks on Saudi infrastructure and shipping routes have once more brought focused supply concerns. WTI also traded towards $102.9-$103.
This is an earnings tailwind for Exxon, as Upstream profits remain highly sensitive to realized crude prices.
The qualification matters. Exxon lost approximately $1.06 billion of upstream earnings in Q2 as a result of Middle East production disruption. Exxon disclosed a $1.06 billion Q2 Upstream earnings hit specifically from Middle East volume disruptions. This means $105-$110 oil caused by real world physical supply disruption is less attractive than $95-$100 oil caused healthy global demand.
Even in this case, if Brent remained above $100 for the next several months without Exxon reducing its own volumes, then the company could have another strong and cash flow positive quarter.
LNG Is Becoming a More Important Growth Leg
Exxon's management commented that the U.S. could make up 30% of global LNG supply by 2030, as there is abundant North American natural gas, and international demand is expected to grow. Exxon’s LNG leadership said the U.S. could account for about 30% of the global LNG market by 2030, supported by abundant North American gas supply and rising international demand.
This matters because LNG is one of Exxon's three major advantaged growth businesses, alongside the Permian and Guyana. The company is looking to reach more than 40 million tonnes per year of LNG sales by 2030.
The U.S. LNG market gains further strategic importance given the Middle East crisis. With elevated shipping risk in the Gulf and an increase in buyer preference for more reliable sources, North American LNG becomes even more important for both Europe and Asia.
Rovuma and Papua LNG Strengthen the Pipeline
Exxon has advanced another step toward the Final Investment Decision (FID) on Rovuma LNG in Mozambique. Area 4 partners have also selected Saipem and Jan De Nul to conduct upstream Engineering, Procurement, Construction and Installation (EPCI) on 18 wells and subsea pipelines and manifolds. Exxon has advanced another step toward the Final Investment Decision (FID) on Rovuma LNG in Mozambique. Area 4 partners selected the Saipem-Jan De Nul consortium for the upstream EPCI scope covering 18 subsea wells, pipelines and manifolds, but the final EPCI award remains subject to FID and government and regulatory approvals.
This follows roughly $1.1B pre-investment contracts awarded in August. If Rovuma reaches FID together with Papua LNG, Exxon will be less reliant on crude oil alone for long-term production growth.
Papua LNG is another important development in September. Exxon has taken operatorship and increased its stake to about 34.1%, within the targeted Q4 2026 FID. Since Exxon already operates neighboring PNG LNG, the project has potential synergies for the infrastructure, logistics and marketing of LNG.
Q2 Cash Generation Remains a Major Strength
The recent reported Quarter still defines the company’s financial position. After adjustments, the company recorded $14.7B earnings, $23.6B operating cash flow, and $17.2B free cash flow for Q2.
The company returned $9.4B to shareholders of which $5.1B was used for buybacks and $4.3B for dividends. Capital return remains crucial as it offers investors a stake in the company’s growing earnings and falling share count from rising commodity prices.
Permian Growth and Pioneer Synergies Keep Improving
A record fell with Permian production exceeding 1.8 million boe/day in Q2. Exxon targets reaching 2.5 million boe/day by 2030, and is increasing estimated annual Pioneer-related synergies to $4B, as compared to the original estimate of $2B.
That is a key point in the XOM thesis. XOM is increasing oil production and is also lowering unit costs and better utilizing capital in one of North America's most advantaged drilling acreages.
Guyana adds a major source of low cost oil production with the next FPSO scheduled to begin in Q4 and an additional 250,000 bopd. Guyana adds a major source of low-cost oil production, with the fifth FPSO scheduled to start in Q4 2026 and add 250,000 barrels per day of capacity.
The Biggest Risk Is Now Too Much Oil Strength
The main risk has shifted. There is no longer a problem of weak commodity prices. High oil prices of $100 and beyond are starting to become macro problems.
Brent at $107 combined with high diesel prices and the renewed inflationary pressures are pushing up interest rates and increasing the yield on treasuries to their current levels of around 5%. Brent near $107 and high diesel prices add to inflation concerns, while the U.S. 10-year Treasury yield has recently traded close to 5% amid broader inflation, fiscal and rate-hike concerns. If crude prices stay high, demand destruction, weaker industrial activities and slowing economic growth will eventually offset the short term positive impact on Exxon's earnings.
I still prefer the environment of $85-$100 Brent for XOM. The current range of $105-$110 Brent is good for short term results, but is starting to become more problematic in the economy as a whole.
ExxonMobil Technical Analysis: $168.60 Is the Breakout Trigger
XOM closed at $165.99 on September 11, exactly at the level indicated on the chart after breaking the $163.80 resistance area. What I like about this is the quick recovery from the area of $158.82, and the formation of a higher low, and a break above the upper boundary of the recent trading range.
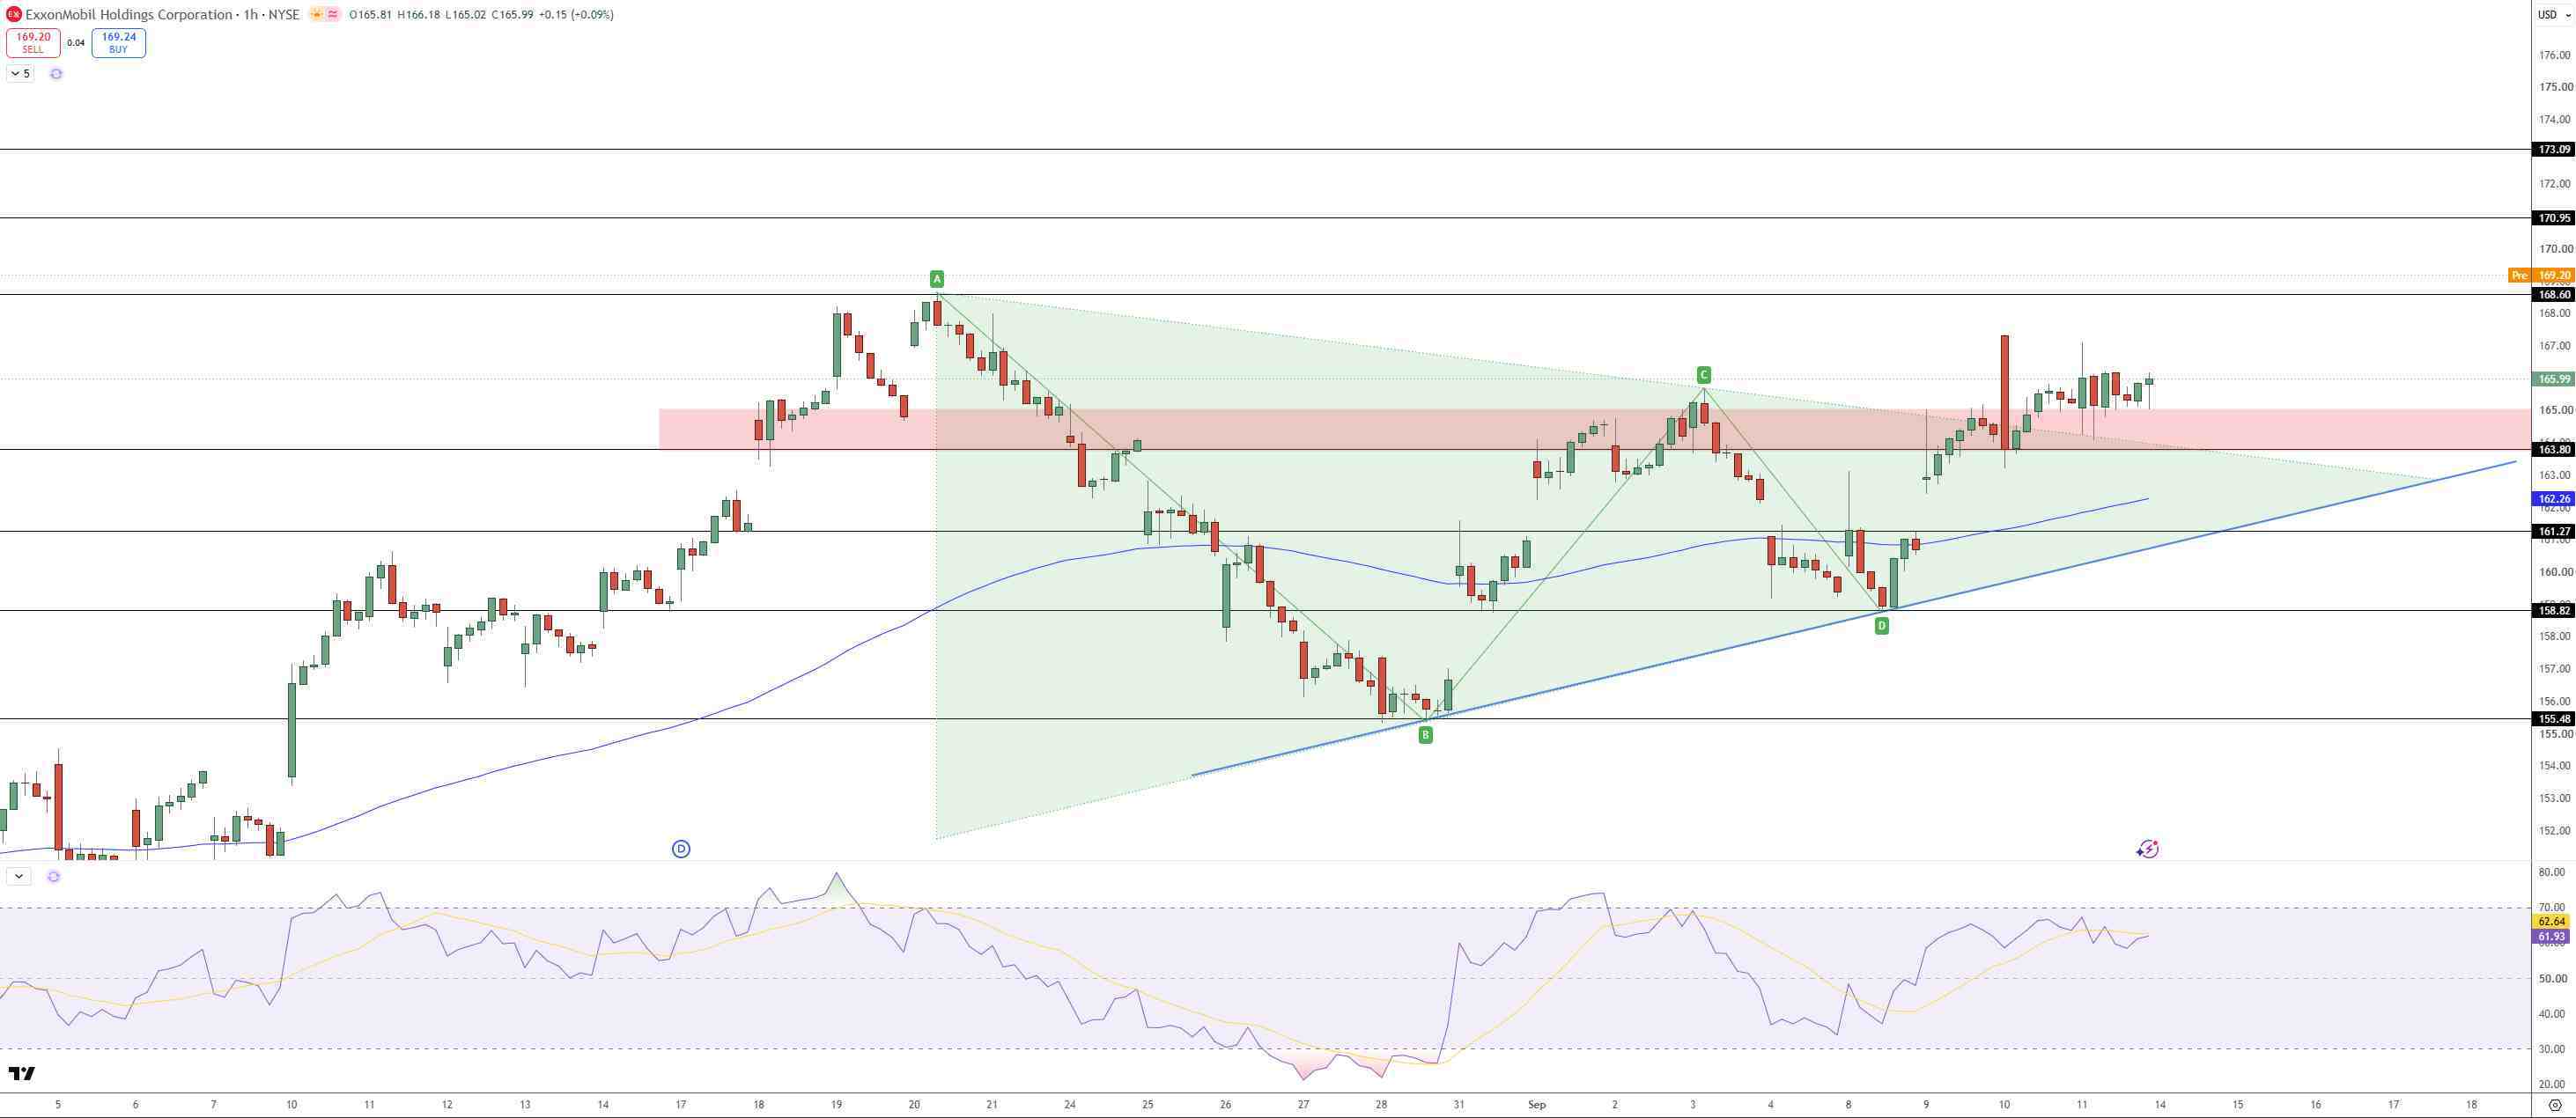
ExxonMobil Price Chart - Source: Tradingview
Immediate resistance is $168.60. An hourly close above that would confirm the bullish continuation set up and would expose the next levels at $170.95 and $173.09. Immediate resistance is $168.60. A sustained hourly close above that would confirm the bullish continuation setup and expose $170.95 and $173.09.
The RSI of 61 is also flat and slightly below the overbought area of 70, indicating that the momentum is present, but not overextended.
If we look at the other side of the trade, $163.80 now becomes the first level of support. A successful break below that level would invalidate the bullish set up. Below that, the moving average is located at $162.26 and horizontal support is at $161.27. A break below that would expose $158.82.
Key Levels
· Latest completed close: $165.99
· Breakout support: $163.80
· Moving-average support: $162.26
· Horizontal support: $161.27
· Major support: $158.82
· Breakout resistance: $168.60
· First upside target: $170.95
· Higher target: $173.09
· RSI: Around 61, constructive and not overbought
Why is ExxonMobil stock in focus now?
Exxon has both a growing LNG business and exposure to rising oil prices and this is also drawing attention to Exxon stock now. At near $107 per barrel of the oil price, record Permian Basin output and strong Q2 free cash flow, with good progress at Rovuma and Papua LNG, this is quite bullish.
What level confirms further XOM upside?
If the stock moves to close above $168.60 then we would confirm the bullish breakout, and $170.95 and $173.09 would be the targets. A sustained hourly close above $168.60 would provide the cleaner breakout confirmation. If on the other hand it moves back below $163.80 then we would see the breakout as having failed and $162.26 and $161.27 would be back in focus.
Bottom Line
ExxonMobil has a much better setup for September 14 than it did three days ago largely due to the oil price bumping up again and also because the LNG activity is picking up. Near $107 for Brent's has positive near term Upstream cash flows. Rovuma, Papua LNG, record Permian output, and Pioneer's integration supports positive longer term growth cash flows. The biggest concern is what happens to the world economy if oil prices move to and stay at $100 or more. Technically, I am bullish on ExxonMobil stock as long as it remains trading above $163.80, and if it clears $168.60 then $170.95 and $173.09 would come into play.
Recommended Articles


