


The Dow, S&P 500, and Nasdaq All Fell 0.4% on Oil and Inflation
Key Points
Wholesale prices rose 5.4% from a year ago in August, up from 4.8% in July.
Brent crude topped $105 a barrel for the first time since May.
Friday's consumer price index is the last data the Fed sees before it votes on the rate policy next week.
- 10 stocks we like better than S&P 500 Index ›
Wholesale prices came in hot on Thursday morning, oil kept climbing, and the market did the math. Odds of a Fed rate hike next week jumped to 70%.
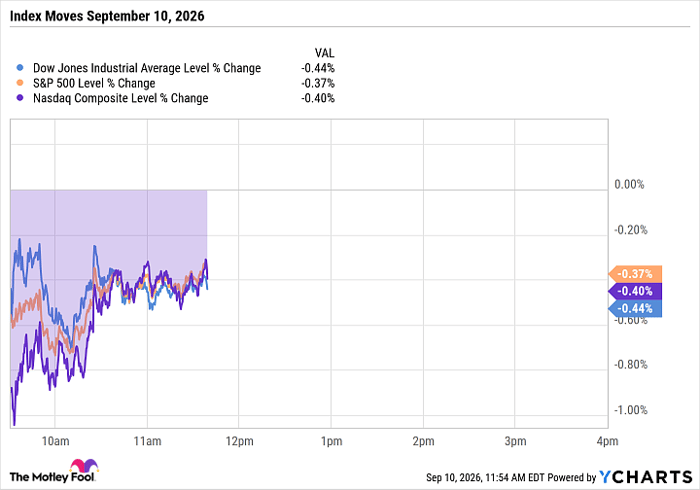
The Dow Jones Industrial Average (DJINDICES: ^DJI) dropped 0.4% as of 11:53 a.m. ET, matching the Nasdaq Composite (NASDAQINDEX: ^IXIC) and the S&P 500 (SNPINDEX: ^GSPC). The major indexes started the day in different moods, but are now a rounding error away from identical.
Missed Nvidia in 2009? This Rare Signal Is Flashing Again. In 2009, a "Double Down" signal flashed for a little-known chipmaker called Nvidia. For the first time in years, that same "Total Conviction" signal is flashing for a company 1/100th the size of Nvidia. Continue »
^DJI data by YCharts
Oil at $105 may force the Fed's hand
Producer prices rose 5.4% from a year ago in August, up from 4.8% in July. Core wholesale prices, excluding food and energy, climbed 4.6% annually against 4.2% in July. The eye-catching figure is diesel, up 24.1% in a single month and about 78% over the year, which matters because almost everything on a store shelf rode a truck at least part of the way.
Crude kept climbing while the inflation report landed. Brent climbed about 3.5% past $105 a barrel, its first visit since May, and U.S. crude crossed $100. The United States Oil Fund (NYSEMKT: USO) rose 4.5% and was one of the very few things in the green this morning.

Image source: Getty Images.
Traders responded immediately. CME Group's FedWatch gauge put the odds of a rate hike at the Sept. 15-16 meeting at 70%, and the probability of a second increase by December rose to roughly 60%. The European Central Bank set a global example by hiking its benchmark interest rate by a quarter point this morning. The European bank pointed to the Iran war for its worsening inflation outlook. Will the American Fed focus on the same signals?
Among individual stocks, Nvidia (NASDAQ: NVDA) was the heaviest weight on both the S&P 500 and the Nasdaq Composite after a 2.1% fall. Memory stocks backed down from a winning Wednesday, with Micron Technology (NASDAQ: MU) down 4.1% and SK Hynix (NASDAQ: SKHY) off by 2.7%.
Apple (NASDAQ: AAPL) dared to move the other way, gaining 1.4% and adding 27 Dow points, one day after the foldable iPhone launch sent it down 1.1%. The new devices didn't debut to thunderous applause, but Wall Street is drawing different conclusions today.
Friday morning decides everything
The Consumer Price Index (CPI) arrives Friday morning, the final inflation reading before the Fed convenes. Economists expect a 3.4% headline reading and 2.4% at the core.
That single number carries the meeting. Fed governor Christopher Waller has said he'd back holding steady if prices are cooling. Chair Kevin Warsh wants proof that underlying inflation is actually heading down to 2%. Bank of America ran the numbers on Thursday's producer data and thinks that core PCE is tracking at 0.3% for the month, which greenlights a hike in the massive bank's eyes.
Investors watching the tape should note where the pain landed. Rate-sensitive names took most of the beating while defensive consumer goods stocks held up pretty well. Gold and Bitcoin (CRYPTO: BTC) both fell, which is strange on an inflation-scare day and suggests that fears about fundamental rate increases are overshadowing concerns about currency debasement. If that's an unfamiliar term, debasement is the fear that dollars themselves lose value as federal debt piles up.
That's four down days in a row, but the moves have been rather small -- the S&P 500 is still less than 3% below its all-time peak. Friday morning decides whether it stays there.
Should you buy stock in S&P 500 Index right now?
Before you buy stock in S&P 500 Index, consider this:
The Motley Fool Stock Advisor analyst team just identified what they believe are the 10 best stocks for investors to buy now… and S&P 500 Index wasn’t one of them. The 10 stocks that made the cut could produce monster returns in the coming years.
Consider when Netflix made this list on December 17, 2004... if you invested $1,000 at the time of our recommendation, you’d have $410,024!* Or when Nvidia made this list on April 15, 2005... if you invested $1,000 at the time of our recommendation, you’d have $1,372,815!*
Now, it’s worth noting Stock Advisor’s total average return is 950% — a market-crushing outperformance compared to 211% for the S&P 500. Don't miss the latest top 10 list, available with Stock Advisor, and join an investing community built by individual investors for individual investors.
See the 10 stocks »
*Stock Advisor returns as of September 10, 2026.
Bank of America is an advertising partner of Motley Fool Money. Anders Bylund has positions in Bitcoin, Micron Technology, and Nvidia. The Motley Fool has positions in and recommends Apple, Bitcoin, Micron Technology, and Nvidia. The Motley Fool has a disclosure policy.
Recommended Articles


