


The S&P 500 Is at a Near-Record High. Here's What History Says Every Long-Term Investor Should Do Right Now.
Key Points
The S&P 500 index has trended higher over time, but it moves in a zigzag pattern.
If history is any guide, long-term investors shouldn't panic if the stock market falls dramatically.
- 10 stocks we like better than Vanguard S&P 500 ETF ›
Between 2000 and 2002, the S&P 500 index (SNPINDEX: ^GSPC) lost 40% of its value. If you go from the highest point to the lowest point over that span, the decline was just shy of 50%! That period, when the dot-com bubble burst, was a brutal period for investors. And yet, if you look at a graph of the S&P 500 index today, that drop is barely even noticeable.
Bear markets happen; that's just how investing works
Having lived through the dot-com crash, I can assure you that every investor was well aware of the bear market at the time. The same was true for the bear market around the Great Recession, another deep one. But, like the dot-com bubble, the Great Recession is also just a blip in the S&P 500 index's long upward climb.
Missed Nvidia in 2009? This Rare Signal Is Flashing Again. In 2009, a "Double Down" signal flashed for a little-known chipmaker called Nvidia. For the first time in years, that same "Total Conviction" signal is flashing for a company 1/100th the size of Nvidia. Continue »

Image source: Getty Images.
Bear markets are emotionally difficult periods. They do bad things to the value of your portfolio. And, history shows, they eventually end. If you look at the long history of the S&P 500 index, a bull market has followed every bear market. Of course, a bear market follows every bull market, too. But if you just have the perseverance to stick to your long-term plan, history says you will likely end up better off than if you panic and make rash, short-term decisions.
The easiest long-term plan is probably to buy and hold the S&P 500 index via an exchange-traded fund (ETF) such as SPDR S&P 500 ETF (NYSEMKT: SPY) or Vanguard S&P 500 ETF (NYSEMKT: VOO). They do the same thing, but SPDR S&P 500 ETF has a 0.09% expense ratio, while Vanguard S&P 500 ETF has an even lower expense ratio of 0.03%. Vanguard's ETF clearly has the edge on cost, but neither one of them is all that expensive to own.
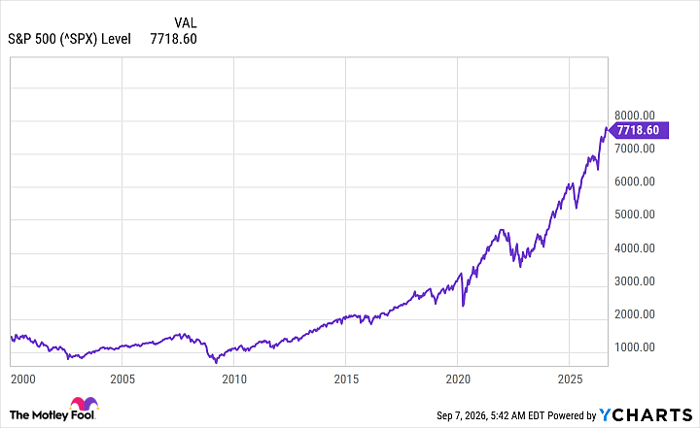
^SPX data by YCharts
Buying is the easy part; holding through thick and thin is the key
It is difficult to describe the emotional drain of holding stocks during a bear market. The value of your portfolio gets smaller day after day, increasing your fear that, eventually, you'll have nothing left. It's brutal, but history is very clear that the market will eventually turn higher again. And if you can just sit through the bear market, the S&P 500 index will someday reward you by reaching an even higher high.
So, if you can contain your emotions and stick to a long-term plan to buy and hold, even today's lofty stock market shouldn't be a big worry. That said, the same buy-and-hold mentality is likely to work if you buy a diversified portfolio of individual stocks, too. The real key is to have a solid long-term investment plan and stick to it, even when every fiber of your being is telling you to sell everything and stuff the cash under your mattress.
Should you buy stock in Vanguard S&P 500 ETF right now?
Before you buy stock in Vanguard S&P 500 ETF, consider this:
The Motley Fool Stock Advisor analyst team just identified what they believe are the 10 best stocks for investors to buy now… and Vanguard S&P 500 ETF wasn’t one of them. The 10 stocks that made the cut could produce monster returns in the coming years.
Consider when Netflix made this list on December 17, 2004... if you invested $1,000 at the time of our recommendation, you’d have $421,997!* Or when Nvidia made this list on April 15, 2005... if you invested $1,000 at the time of our recommendation, you’d have $1,413,876!*
Now, it’s worth noting Stock Advisor’s total average return is 978% — a market-crushing outperformance compared to 213% for the S&P 500. Don't miss the latest top 10 list, available with Stock Advisor, and join an investing community built by individual investors for individual investors.
See the 10 stocks »
*Stock Advisor returns as of September 7, 2026.
Reuben Gregg Brewer has no position in any of the stocks mentioned. The Motley Fool has positions in and recommends Vanguard S&P 500 ETF. The Motley Fool has a disclosure policy.
Recommended Articles


