


Should You Forget High-Yield Dividend ETFs and Buy a Dividend Growth ETF Instead?
Key Points
A high-yield dividend ETF like Global X SuperDividend U.S. ETF pays out a yield of 6.55%.
A divided growth ETF like the Vanguard Dividend Appreciation ETF typically has a higher total return.
The Schwab U.S. Dividend Equity ETF gives you a bit of both.
- 10 stocks we like better than Schwab U.S. Dividend Equity ETF ›
While there are tons of dividend exchange-traded funds (ETFs) to choose from, there are two broad categories that investors gravitate toward. One type focuses on high-yield dividend stocks, while another major category focuses on stocks that consistently grow their dividends.
Is one preferable to the other? It depends on what you are looking for.
Missed Nvidia in 2009? This Rare Signal Is Flashing Again. In 2009, a "Double Down" signal flashed for a little-known chipmaker called Nvidia. For the first time in years, that same "Total Conviction" signal is flashing for a company 1/100th the size of Nvidia. Continue »

Image source: Getty Images.
Global X SuperDividend US ETF
A high-yield dividend ETF invests in stocks that generate the highest dividend yields. One prime example is the Global X SuperDividend U.S. ETF (NYSEMKT: DIV). This ETF follows the Indxx SuperDividend U.S. Low Volatility Index, which includes the 50 stocks with the highest dividend yields, including real estate investment trusts (REITs). The stocks also must have paid dividends consistently over the last two years. There are also beta screens to ensure lower relative volatility.
The portfolio is equal-weighted, but some of the largest holdings, based on price movements and other factors, are Tsakos Energy Navigation, which has a yield of 4.62%, and CBL & Associates, a REIT with a yield of 4.59%.
Overall, this ETF has an extremely high 12-month distribution yield of 6.55%, paid monthly.
This ETF would be favored by investors, perhaps retirees, who are looking for high dividend income payouts. The trade-off is that long-term returns may be lower, even though the reinvested dividend will boost total return. But still, you are investing in stocks for their high dividends, not their long-term stability and growth.
For example, this ETF has a five-year average annualized return of negative 0.5% and a five-year average total return of 6.4%. Now let's compare that to a dividend growth ETF.
Vanguard Dividend Appreciation ETF
The Vanguard Dividend Appreciation ETF (NYSEMKT: VIG) is a good example of a dividend growth ETF, offering a solid contrast to a high-yield dividend ETF like DIV.
The Vanguard Dividend Appreciation ETF tracks the S&P U.S. Dividend Growers Index, which focuses on stocks, excluding REITs, with a record of increasing dividends annually. The focus is on annual growth, not high yields, as the top three holdings -- Broadcom, Microsoft, and Apple -- show. These are not what you'd call high-yield stocks.
Broadcom has a dividend yield of just 0.71%, but it has increased it for 15 consecutive years. Microsoft has a yield of 0.73% but has boosted it for 21 straight years. Apple's yield is just 0.33%, but it has increased for 13 consecutive years.
Thus, the 12-month distribution yield for the Vanguard Dividend Appreciation ETF is just 1.48%, which pales in comparison to the Global X ETF.
But the benefit of the Vanguard Dividend Appreciation ETF and other dividend growth ETFs is that they invest in larger, stable, established, well-capitalized companies that increase their dividends year after year.
That typically results in higher long-term returns than high-yield-oriented ETFs. The VIG ETF, for example, has a five-year average annualized total return of 10.2% compared to 6.4% for the Global X SuperDividend US ETF.
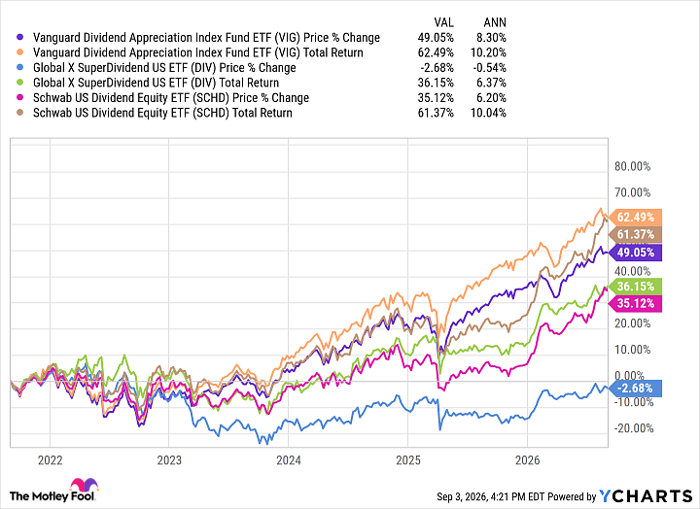
Data by YCharts.
Schwab U.S. Dividend Equity ETF
While both DIV and VIG represent opposite ends of the spectrum, some ETFs occupy the middle ground, such as the Schwab U.S. Dividend Equity ETF (NYSEMKT: SCHD).
This popular ETF tracks the Dow Jones U.S. Dividend 100 Index and includes the highest-yielding stocks with at least 10 consecutive years of dividend payments. They must also meet certain screens to ensure adequate liquidity and solid fundamentals. In addition, the stocks must have grown dividends for at least five years.
Its top three holdings are Merck, Amgen, and Abbott Labs.
The SCHD ETF is really the best of both worlds, as it has an excellent 12-month distribution yield of 3.13% and a strong record of returns. Specifically, it has a five-year average annualized total return of 10%, nearly on par with VIG.
If I had to pick one, it would be the Schwab ETF because it gives you both stable dividend growth and high yields. But if you are looking for just high yields or the potential for higher total returns, then the other two might be options.
Should you buy stock in Schwab U.S. Dividend Equity ETF right now?
Before you buy stock in Schwab U.S. Dividend Equity ETF, consider this:
The Motley Fool Stock Advisor analyst team just identified what they believe are the 10 best stocks for investors to buy now… and Schwab U.S. Dividend Equity ETF wasn’t one of them. The 10 stocks that made the cut could produce monster returns in the coming years.
Consider when Netflix made this list on December 17, 2004... if you invested $1,000 at the time of our recommendation, you’d have $421,997!* Or when Nvidia made this list on April 15, 2005... if you invested $1,000 at the time of our recommendation, you’d have $1,413,876!*
Now, it’s worth noting Stock Advisor’s total average return is 978% — a market-crushing outperformance compared to 213% for the S&P 500. Don't miss the latest top 10 list, available with Stock Advisor, and join an investing community built by individual investors for individual investors.
See the 10 stocks »
*Stock Advisor returns as of September 6, 2026.
Dave Kovaleski has no position in any of the stocks mentioned. The Motley Fool has positions in and recommends Abbott Laboratories, Amgen, Apple, Broadcom, Merck, Microsoft, and Vanguard Dividend Appreciation ETF. The Motley Fool has a disclosure policy.
Recommended Articles


