


Why I'm Still Investing in VTI Right Now No Matter What the Stock Market Does
Key Points
The S&P 500 has delivered 593% total return since September 2011 and 10% annualized returns since 1928.
The Vanguard Morningstar Total Stock Market ETF holds 3,515 U.S. stocks of all sizes, including the S&P 500.
- 10 stocks we like better than Vanguard Morningstar Total Stock Market ETF ›
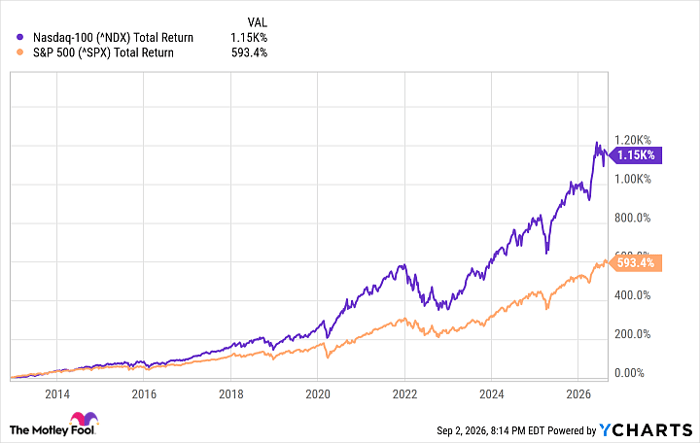
The stock market has been so good for so long, that it's making some investors suspicious. The S&P 500 index (SNPINDEX: ^GSPC) has delivered a total return of 593% in the past 15 years. The tech-heavy Nasdaq-100 index has done even better with a total return of 1,150% during that time.
Missed Nvidia in 2009? This Rare Signal Is Flashing Again. In 2009, a "Double Down" signal flashed for a little-known chipmaker called Nvidia. For the first time in years, that same "Total Conviction" signal is flashing for a company 1/100th the size of Nvidia. Continue »
^NDX data by YCharts
Can the good times on Wall Street really keep going? What if the artificial intelligence (AI) boom that has powered hundreds of billions of dollars of capital expenditure and investor excitement turns out to be overvalued and overhyped? What if we're overdue for a bear market?
During any given day, month, or year, the stock market can lose value. This is why day trading and short-term speculation can be so risky and unlikely to succeed. But I'm not focused on what happens in the stock market tomorrow or this year.
Any money I invest today is going to be left invested for the next 10 years or more. And as a long-term investor, I believe that no matter what happens next, as a long-term investor, it's a good decision to keep investing in the Vanguard Morningstar Total Stock Market ETF (NYSEMKT: VTI).
Let's look at the broader picture of why I'm going to keep investing in VTI today, tomorrow, and hopefully for years to come.
Image source: Getty Images.
The U.S. stock market has delivered 10% annualized returns for 98 years
When most people talk about "the stock market," they mean the S&P 500 index. These 500 names represent the largest publicly traded companies in America. For the past 98 years since 1928, the S&P 500 has delivered average annual returns of about 10% per year.
This is a quietly remarkable fact. It deserves more attention. Just by buying and holding a low-cost S&P 500 exchange-traded fund (ETF) for many years, investors can gain significant wealth. With 10% average annual returns, $200 invested per month over the course of a 40-year working career would grow to more than $1 million .
Keep in mind that the 10% average annual return of the S&P 500 includes all the major economic disasters and stock market crashes that have happened since 1928. The Great Depression, World War II, the 1970s energy crisis and high inflation, the dot-com bust, and the global financial crisis of 2008 didn't stop long-term investors from achieving big gains.
There are always problems, conflicts, and crises happening in the world. No time is ever perfectly safe to invest. Short-term stock market downturns are going to happen. But do you really feel like now is a worse time to invest than World War II or the Great Depression?
VTI: A low-cost way to buy "all" the stocks in America
One good way to buy stocks is to use a low-cost S&P 500 ETF. But the U.S. stock market is even bigger than the S&P 500. The Vanguard Morningstar Total Stock Market ETF lets you tap into that broader diversification. VTI holds 3,515 stocks and has delivered average annual returns of about 14.8% for the past 10 years and 11.7% in the past five years -- even better than the long-term S&P 500 average.
The VTI fund's portfolio includes large-caps like the S&P 500, as well as mid-cap and small-cap stocks of smaller companies. With VTI, you can buy pretty much all the stocks in America for a rock-bottom expense ratio of 0.03%. I buy VTI instead of an S&P 500 ETF because I want exposure to all the stocks of those smaller companies, not just the 500 largest.
The stock market has a 98-year track record of resilience for long-term investors. If you can leave your money invested and leave it alone to keep compounding for at least five to 10 years, there's almost never a "bad time" to buy stocks with a low-cost index fund like the Vanguard Morningstar Total Stock Market ETF.
Should you buy stock in Vanguard Morningstar Total Stock Market ETF right now?
Before you buy stock in Vanguard Morningstar Total Stock Market ETF, consider this:
The Motley Fool Stock Advisor analyst team just identified what they believe are the 10 best stocks for investors to buy now… and Vanguard Morningstar Total Stock Market ETF wasn’t one of them. The 10 stocks that made the cut could produce monster returns in the coming years.
Consider when Netflix made this list on December 17, 2004... if you invested $1,000 at the time of our recommendation, you’d have $421,997!* Or when Nvidia made this list on April 15, 2005... if you invested $1,000 at the time of our recommendation, you’d have $1,413,876!*
Now, it’s worth noting Stock Advisor’s total average return is 978% — a market-crushing outperformance compared to 213% for the S&P 500. Don't miss the latest top 10 list, available with Stock Advisor, and join an investing community built by individual investors for individual investors.
See the 10 stocks »
*Stock Advisor returns as of September 5, 2026.
Ben Gran has positions in Vanguard Morningstar Total Stock Market ETF. The Motley Fool has no position in any of the stocks mentioned. The Motley Fool has a disclosure policy.
Recommended Articles


