


If a Downturn Is Coming, 50 Years of Market History Says This Is the Single Best Response
Key Points
The stock market goes up and down over time, but the long-term trend is upward.
Getting caught up in the zigs and zags of Wall Street could leave you worse off than simply doing nothing.
- 10 stocks we like better than Vanguard S&P 500 ETF ›
Winnie the Pooh probably isn't the investment guru that first comes to mind when you think about Wall Street. And yet he has offered some pretty sage investing advice: "Doing nothing often leads to the very best of something." The history of investing over the past 50 years very clearly shows that this fictional, honey-loving bear could be on to something. Here's why.
The S&P 500 goes up and down, and then up again
Turning to a real person, iconic investor Warren Buffett, the former CEO of Berkshire Hathaway (NYSE: BRKA)(NYSE: BRKB), has said that "Investing is not a game where the guy with the 160 IQ beats the guy with the 130 IQ. Once you have ordinary intelligence, what you need is the temperament to control the urges that get other people into trouble in investing."
Missed Nvidia in 2009? This Rare Signal Is Flashing Again. In 2009, a "Double Down" signal flashed for a little-known chipmaker called Nvidia. For the first time in years, that same "Total Conviction" signal is flashing for a company 1/100th the size of Nvidia. Continue »

Image source: Getty Images.
The issue of temperament is where Buffett and Pooh intersect. That's because the S&P 500 index's (SNPINDEX: ^GSPC) history shows that Wall Street switches between bull and bear markets in a zigzag fashion, while generally moving higher over time. The chart below shows that simply buying and holding the S&P 500 index would have yielded a positive long-term outcome if you had the temperament to do nothing while it gyrated in the short term.
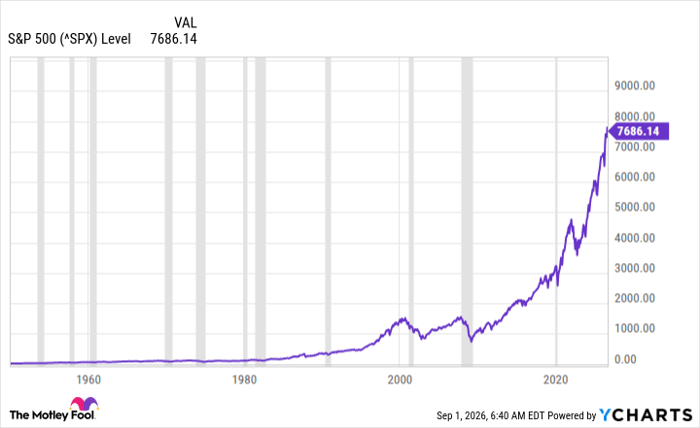
^SPX data by YCharts
In fact, Warren Buffett has actually suggested that most investors would be better off just buying the S&P 500 index and... doing nothing. That's not entirely true; Buffett would likely recommend continuing to regularly buy an S&P 500 index ETF, such as SPDR S&P 500 ETF (NYSEMKT: SPY) or Vanguard S&P 500 ETF (NYSEMKT: VOO), regardless of market conditions.
Think long term, even when Wall Street is thinking short term
Buying every month (or at another regular interval) is known as dollar-cost averaging, which can be a powerful wealth-building tool. But the real key is to avoid market timing, or trying to buy and sell to take advantage of short-term price movements. That is difficult, if not impossible, to do successfully over the long term. Market timing would be one of the "urges" that get investors into trouble. And if you have the right temperament, 50 years of Wall Street history says you shouldn't do it.
Instead, you should channel your inner Winnie the Pooh and do nothing. Well, nothing other than sticking to the same investment plan you had before the bear market downturn. In the end, buying and holding for the long term has a pretty incredible 50-year track record.
Should you buy stock in Vanguard S&P 500 ETF right now?
Before you buy stock in Vanguard S&P 500 ETF, consider this:
The Motley Fool Stock Advisor analyst team just identified what they believe are the 10 best stocks for investors to buy now… and Vanguard S&P 500 ETF wasn’t one of them. The 10 stocks that made the cut could produce monster returns in the coming years.
Consider when Netflix made this list on December 17, 2004... if you invested $1,000 at the time of our recommendation, you’d have $421,997!* Or when Nvidia made this list on April 15, 2005... if you invested $1,000 at the time of our recommendation, you’d have $1,413,876!*
Now, it’s worth noting Stock Advisor’s total average return is 978% — a market-crushing outperformance compared to 213% for the S&P 500. Don't miss the latest top 10 list, available with Stock Advisor, and join an investing community built by individual investors for individual investors.
See the 10 stocks »
*Stock Advisor returns as of September 5, 2026.
Reuben Gregg Brewer has no position in any of the stocks mentioned. The Motley Fool has positions in and recommends Berkshire Hathaway and Vanguard S&P 500 ETF. The Motley Fool has a disclosure policy.
Recommended Articles


