


If a Market Correction Is Coming, This 1 Move Could Define Your Next Decade of Returns
Key Points
The S&P 500 has tripled since bottoming out early in the pandemic.
The most recent official market correction happened last year when President Trump announced new tariffs.
You need to keep funds available to buy on the dip to benefit from market drops.
- 10 stocks we like better than S&P 500 Index ›
There haven't been that many market crashes in history. Although the market goes through peaks and troughs all the time, the major trend is higher, and long-term investors have enjoyed tremendous benefits.
The last major crash, early in the pandemic, was also the shortest. The S&P 500 (SNPINDEX: ^GSPC) lost 34% of its value in less than four weeks, but regained it within four months. Investors who didn't panic sell have been richly rewarded. In fact, since bottoming out in 2020, the S&P 500 has more than tripled.
Missed Nvidia in 2009? This Rare Signal Is Flashing Again. In 2009, a "Double Down" signal flashed for a little-known chipmaker called Nvidia. For the first time in years, that same "Total Conviction" signal is flashing for a company 1/100th the size of Nvidia. Continue »
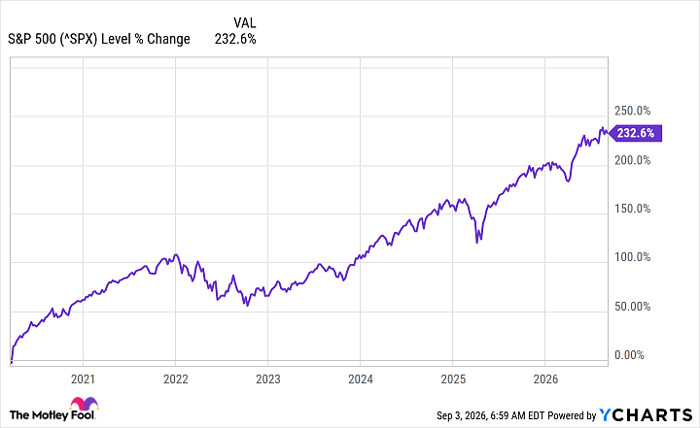
^SPX data by YCharts
Another market crash or correction could be on the way, and even if it's not, it will happen at some point. This one move could define your next decade of returns.
Prepare for bargains
First, some definitions. A market crash is defined as a rapid, intense drop in any of the major indexes, including the S&P 500, the Dow Jones Industrial Average (DJINDICES: ^DJI), and the Nasdaq Composite (NASDAQINDEX: ^IXIC). To be considered a crash, the drop must be at least 20%, and it usually affects other parts of the economy. A more prolonged 20% drop would usually be called a bear market.
A correction, on the other hand, is usually between 10% and 20%. When the S&P 500 lost 9.1% of its value this year after the war with Iran began, it didn't technically meet the criteria for a correction, and it bounced back quickly.

Image source: Getty Images.
Last year, when the S&P 500 lost 17% between its high and low after President Donald Trump announced new tariffs, it would have been called a correction. The market recovered from that quickly as well.
Part of what drove the rebound each time were investors with cash at the ready to take advantage of bargains. And you should also have funds prepared for the next time it happens.
That doesn't mean you avoid the market today; however, you should be very choosy about your stocks and be vigilant about not overpaying, which can be a challenge when everyone's buying high-priced stocks. "Keep buying it through thick and thin," Warren Buffett said in an interview in 2017, "and especially through thin."
The investing legend has credited a few good moves for most of his success, and you can't benefit from the rare bargains if you don't have money set aside. That's why keeping some funds available could define your next decade of returns.
Should you buy stock in S&P 500 Index right now?
Before you buy stock in S&P 500 Index, consider this:
The Motley Fool Stock Advisor analyst team just identified what they believe are the 10 best stocks for investors to buy now… and S&P 500 Index wasn’t one of them. The 10 stocks that made the cut could produce monster returns in the coming years.
Consider when Netflix made this list on December 17, 2004... if you invested $1,000 at the time of our recommendation, you’d have $446,157!* Or when Nvidia made this list on April 15, 2005... if you invested $1,000 at the time of our recommendation, you’d have $1,377,357!*
Now, it’s worth noting Stock Advisor’s total average return is 983% — a market-crushing outperformance compared to 212% for the S&P 500. Don't miss the latest top 10 list, available with Stock Advisor, and join an investing community built by individual investors for individual investors.
See the 10 stocks »
*Stock Advisor returns as of September 4, 2026.
Jennifer Saibil has no position in any of the stocks mentioned. The Motley Fool has no position in any of the stocks mentioned. The Motley Fool has a disclosure policy.
Recommended Articles


