


Will Nvidia Shock the World and Be the First Company to Reach $1 Trillion in Revenue? Here's What the Math Says.
Key Points
Nvidia is guiding for 70% revenue growth next fiscal year.
This puts it on the doorstep of generating $1 trillion in annual sales.
It is hard to value the stock during the AI boom.
- 10 stocks we like better than Nvidia ›
It has done it again. Nvidia (NASDAQ: NVDA) blew past Wall Street estimates in its second-quarter (Q2) earnings, sending the stock back toward its all-time high share price of $225. The chipmaker now has a market cap approaching $5.5 trillion, making it the largest company in the world.
Where Nvidia truly shone was its guidance for the next fiscal year, which has astounded investors. In fact, it could put the company on the doorstep of becoming the first business in world history to generate $1 trillion in annual revenue, up from well under $100 billion just a few years ago.
Missed Nvidia in 2009? This Rare Signal Is Flashing Again. In 2009, a "Double Down" signal flashed for a little-known chipmaker called Nvidia. For the first time in years, that same "Total Conviction" signal is flashing for a company 1/100th the size of Nvidia. Continue »
But does that make the stock a buy today? Let's find out.

Image source: Nvidia.
Monster guidance for next year
For context, let's give some numbers around Nvidia's current financial performance. Over the last 12 months, it has generated $303 billion in revenue. Last quarter, which ended in August, saw revenue grow 106% to $106 billion. If this type of growth continues for the next two quarters of this fiscal year (which ends in January of 2027), then Nvidia is likely knocking on the door of generating over $400 billion in sales in a 12-month period.
What was even more impressive was the fact that Nvidia is already projecting 70% revenue growth next fiscal year, which is named fiscal year 2028. This is due to the insatiable demand from the cloud providers for artificial intelligence (AI) computer chip systems, neoclouds like Space Exploration Technologies, and Nvidia raising prices. Add 70% growth to the $400 billion in fiscal year 2027 revenue, and Nvidia may generate $700 billion to $800 billion in revenue next fiscal year.
That is up from just $27 billion in revenue in fiscal year 2023, only a few years ago.
The math behind $1 trillion in revenue
If Nvidia can grow its sales by 70% next fiscal year to $700 billion, it will only need around 40% revenue growth in fiscal year 2029 to eclipse $1 trillion in sales. This feels highly achievable if AI infrastructure investments continue to grow at today's pace.
But will Nvidia be the first stock to $1 trillion? That is a harder question to answer because of Amazon (NASDAQ: AMZN). Amazon is already at $775 billion in revenue, meaning it will only need two years of 15% revenue growth to eclipse $1 trillion. Its sales grew 20% year over year last quarter, mainly due to AI demand. What this means is that if Nvidia keeps growing revenue at this pace, Amazon will likely do the same and reach $1 trillion in revenue first.
Either way, both companies -- but especially Nvidia -- are growing rapidly today because of AI.
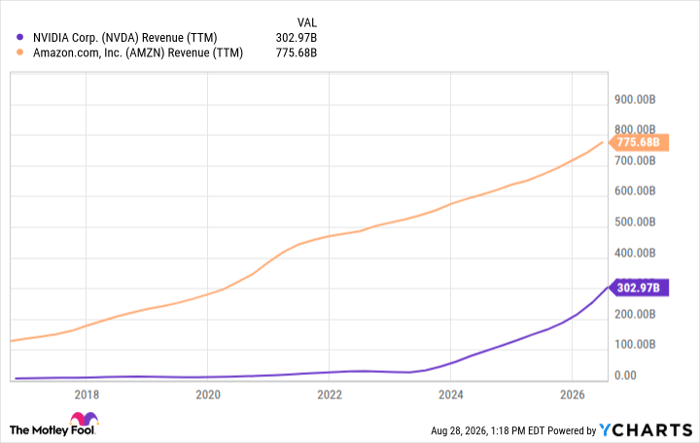
Data by YCharts.
Is Nvidia stock a buy?
Unlike Amazon, whose capital-intensive e-commerce and cloud operations require significant capital spending, Nvidia can offload capital spending to its hardware providers, allowing it to generate fantastic profit margins. Over the last 12 months, it has posted an operating margin of 65%, implying $650 billion in operating earnings in fiscal year 2029 if this margin is maintained and revenue grows to $1 trillion.
That would be up from $197 billion over the last 12 months, making Nvidia by far the most profitable business in the world. The final question is: How durable would this $1 trillion in revenue and $650 billion in earnings be? If spending on the AI boom slows -- which may happen within the next 10 years -- Nvidia's revenue could be significantly lower in the near future.
This makes the stock very difficult to value today, especially given its $5.5 trillion market cap. That looks cheap compared to $650 billion in earnings a few years from now, but who's to say what the average earnings power for Nvidia will be every year for the next decade?
Should you buy stock in Nvidia right now?
Before you buy stock in Nvidia, consider this:
The Motley Fool Stock Advisor analyst team just identified what they believe are the 10 best stocks for investors to buy now… and Nvidia wasn’t one of them. The 10 stocks that made the cut could produce monster returns in the coming years.
Consider when Netflix made this list on December 17, 2004... if you invested $1,000 at the time of our recommendation, you’d have $440,710!* Or when Nvidia made this list on April 15, 2005... if you invested $1,000 at the time of our recommendation, you’d have $1,335,252!*
Now, it’s worth noting Stock Advisor’s total average return is 978% — a market-crushing outperformance compared to 213% for the S&P 500. Don't miss the latest top 10 list, available with Stock Advisor, and join an investing community built by individual investors for individual investors.
See the 10 stocks »
*Stock Advisor returns as of August 31, 2026.
Brett Schafer has no position in any of the stocks mentioned. The Motley Fool has positions in and recommends Amazon and Nvidia. The Motley Fool has a disclosure policy.
Recommended Articles


