


What Happens When You Invest in the Stock Market at the Worst Possible Time? History Has Reassuring News for Investors.
Key Points
The stock market has been reaching all-time highs, but a bear market is coming eventually.
Some investors may be hesitant to invest now, instead waiting for a pullback.
History shows that investing consistently can help build long-term wealth despite short-term volatility.
- 10 stocks we like better than S&P 500 Index ›
Over the last few years, the market has been unshakeable. Despite a few bouts of short-term volatility, the S&P 500 (SNPINDEX: ^GSPC), Nasdaq Composite (NASDAQINDEX: ^IXIC), and Dow Jones Industrial Average (DJINDICES: ^DJI) have all notched new all-time highs in recent months.
There's a sneaky downside to a record-breaking stock market, though. When the next bear market hits -- and it is coming eventually -- investors risk buying at peak prices immediately before the market tanks.
Missed Nvidia in 2009? This Rare Signal Is Flashing Again. In 2009, a "Double Down" signal flashed for a little-known chipmaker called Nvidia. For the first time in years, that same "Total Conviction" signal is flashing for a company 1/100th the size of Nvidia. Continue »
It can be daunting to invest near record highs for this reason, and some investors may be tempted to avoid the market altogether and wait for a pullback. But just how bad would it be if you invested at the "worst" possible moment? History suggests it's not as bad as you might think -- with a caveat.
Image source: Getty Images.
The worst recessions all have one trait in common
Even the most brutal recessions, crashes, and bear markets are only temporary. While they're often crushing in the short term, with real financial and economic consequences, long-term investors have historically reaped the rewards.
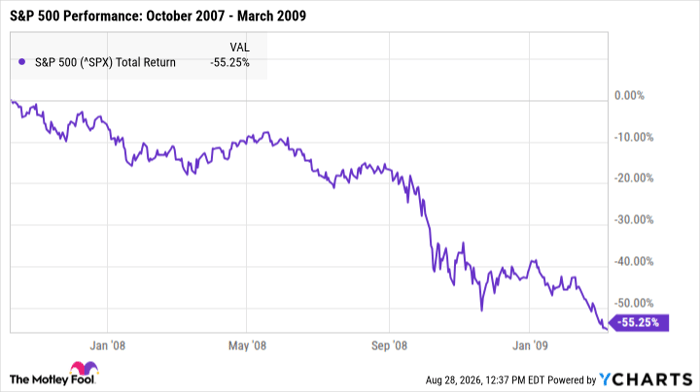
Say, for example, you'd invested in an S&P 500 ETF in October 2007 -- the month the Great Recession officially began. This bear market was the most severe economic downturn post-WWII, and it would take years for the market to fully recover.
^SPX data by YCharts
The most important thing to remember when investing, however, is that losing value is not the same as losing money. Your S&P 500 ETF would have lost 55% of its value throughout the Great Recession, but by staying invested until stocks recovered, you wouldn't have locked in any losses.
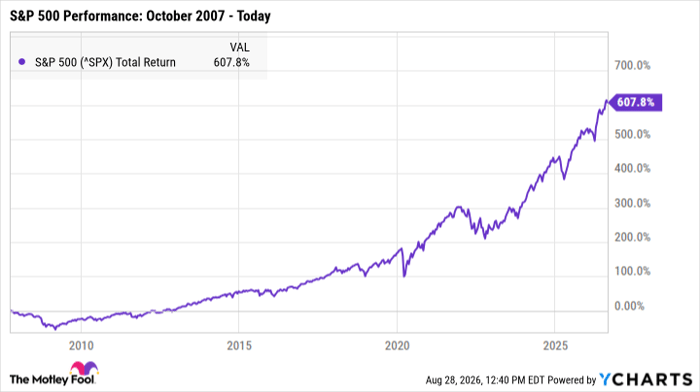
Between October 2007 and today, the S&P 500 has earned total returns of more than 600%. In other words, if you'd invested $10,000 in an S&P 500 ETF back then and made zero additional contributions, you'd have more than $70,000 by today.
^SPX data by YCharts
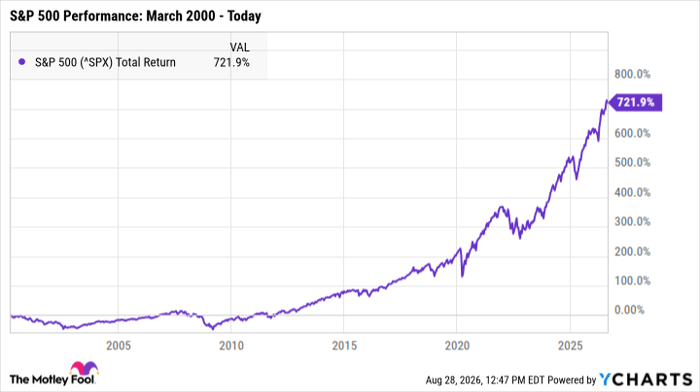
This is a trend that's repeated throughout history, too. The dot-com bubble officially popped in March 2000, and that bear market was arguably worse for many investors. Not only was it one of the longest bear markets in S&P 500 history, but shortly after the market began reaching new highs, the Great Recession hit.
However, if you'd invested in an S&P 500 ETF in March 2000 -- immediately ahead of two back-to-back recessions -- you'd have earned total returns of around 722% by today.
^SPX data by YCharts
History's greatest lesson for investors
If there's just one takeaway for investors, it's that with a long-term outlook, it doesn't necessarily matter when you invest.
Could an investor have theoretically earned more if they'd waited until the market bottomed out during a bear market to buy? Most definitely. But hindsight is 20/20, and in the moment, it's impossible to know where the market is headed.
Rather than waiting for the perfect opportunity to buy, it's often more lucrative to invest consistently and stay in the market for the long haul. Even if you invest at the "wrong" time, history proves that the market will more than make up for it over time.
Should you buy stock in S&P 500 Index right now?
Before you buy stock in S&P 500 Index, consider this:
The Motley Fool Stock Advisor analyst team just identified what they believe are the 10 best stocks for investors to buy now… and S&P 500 Index wasn’t one of them. The 10 stocks that made the cut could produce monster returns in the coming years.
Consider when Netflix made this list on December 17, 2004... if you invested $1,000 at the time of our recommendation, you’d have $440,710!* Or when Nvidia made this list on April 15, 2005... if you invested $1,000 at the time of our recommendation, you’d have $1,335,252!*
Now, it’s worth noting Stock Advisor’s total average return is 978% — a market-crushing outperformance compared to 213% for the S&P 500. Don't miss the latest top 10 list, available with Stock Advisor, and join an investing community built by individual investors for individual investors.
See the 10 stocks »
*Stock Advisor returns as of August 30, 2026.
Katie Brockman has no position in any of the stocks mentioned. The Motley Fool has no position in any of the stocks mentioned. The Motley Fool has a disclosure policy.
Recommended Articles


