


The Stock Market Is Repeating a Pattern Not Seen Since 2000. Here's What History Says Comes Next.
Key Points
The S&P 500 today is the second-most expensive market, according to the CAPE ratio.
The market hasn't been this expensive since the dot-com bubble.
Nobody can predict a crash, but investors can diversify to limit damage.
- 10 stocks we like better than S&P 500 Index ›
If you look closely at the last 150 years of stock market history, you'll see a clear pattern: Periods of extremely high valuations are often followed by disappointing returns, some of which lead to outright crashes.
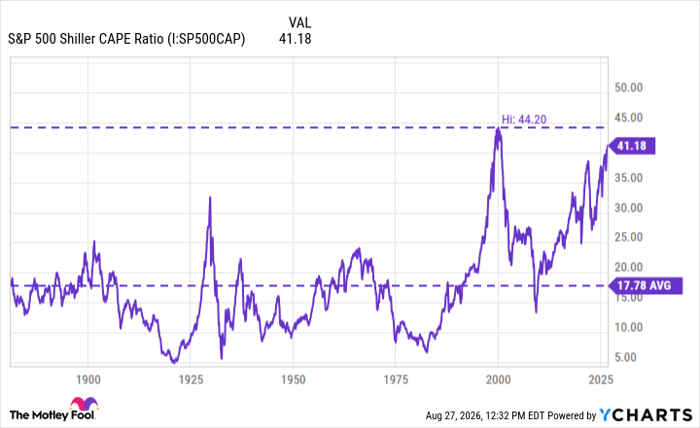
Right now, we're living through one of the most expensive markets in history -- the second most expensive, as measured by the Shiller cyclically adjusted price-to-earnings (P/E) ratio. Since the 1880s, the Shiller CAPE ratio has averaged about 18. At the time of writing, it had exceeded 41. Only once has the market been this expensive, and that was during the dot-com era.
Missed Nvidia in 2009? This Rare Signal Is Flashing Again. In 2009, a "Double Down" signal flashed for a little-known chipmaker called Nvidia. For the first time in years, that same "Total Conviction" signal is flashing for a company 1/100th the size of Nvidia. Continue »
Data by YCharts
What does a high Shiller CAPE ratio actually mean?
The Shiller CAPE ratio is a handy way of evaluating the S&P 500 (SNPINDEX: ^GSPC) based on the last decade of inflation-adjusted earnings. "Inflation-adjusted" is just a technical way of saying those earnings are converted into today's dollars; it makes the comparison more apples-to-apples. Likewise, using a decade of data helps smooth out unusually strong or weak years, which offers a much clearer picture of the market's underlying value.
Typically, a higher-than-average CAPE ratio is a strong signal that the market is expensive. Over the last 30 years, for instance, the average CAPE ratio has been about 29; today's reading of about 41 is exceptionally high.
Image source: Getty Images.
What does an expensive market mean to investors?
An expensive market isn't necessarily bad, nor does it imply that every stock within it is overpriced.
At the same time, high valuations often coincide with overly speculative periods. The speculative nature, which can detach concrete earnings from expectations, is what makes these markets particularly fearsome. Investors expect growth far into the future, leaving little breathing room for disappointment, and any threat to future profits can give the market the jitters, possibly even triggering a crash.
The dot-com crash is an example of this phenomenon. In the mid-to-late 1990s, investors were pouring money into little-known tech companies that had hardly any revenue or profits. At about the same time, the Federal Reserve started raising interest rates -- three times in 1999, followed by three more in 2000.
The Nasdaq Composite (NASDAQINDEX: ^IXIC) peaked in March 2000. Then, a combination of higher interest rates and companies selling their own stock triggered panic. By October 2002, the tech-heavy Nasdaq index had fallen 78% from its peak.
Does history indicate a market crash is coming?
History suggests that the market could crash, but it's impossible to predict when it could occur or how long the damage could last.
On the flip side, the stock market might not crash at all. It might correct itself, which is defined as a 10% drop from recent highs. There's simply no telling what the market will do in the future. You might think you're timing the market by selling now, only to miss the market's best days.
If you're worried about a stock market crash, it might be worth reviewing your portfolio to see if it's properly diversified. A market pullback could hurt some industries more than others, and diversification could help limit the overall damage. You might also want to have some cash on hand in case a correction opens up buying opportunities.
Should you buy stock in S&P 500 Index right now?
Before you buy stock in S&P 500 Index, consider this:
The Motley Fool Stock Advisor analyst team just identified what they believe are the 10 best stocks for investors to buy now… and S&P 500 Index wasn’t one of them. The 10 stocks that made the cut could produce monster returns in the coming years.
Consider when Netflix made this list on December 17, 2004... if you invested $1,000 at the time of our recommendation, you’d have $440,710!* Or when Nvidia made this list on April 15, 2005... if you invested $1,000 at the time of our recommendation, you’d have $1,335,252!*
Now, it’s worth noting Stock Advisor’s total average return is 978% — a market-crushing outperformance compared to 213% for the S&P 500. Don't miss the latest top 10 list, available with Stock Advisor, and join an investing community built by individual investors for individual investors.
See the 10 stocks »
*Stock Advisor returns as of August 30, 2026.
Steven Porrello has no position in any of the stocks mentioned. The Motley Fool has no position in any of the stocks mentioned. The Motley Fool has a disclosure policy.
Recommended Articles


