


The Data Is Clear: Investors Who Make This 1 Move During Bear Markets Always Come Out Ahead
Key Points
All major U.S. indexes have bounced back from past recessions.
Bull markets have historically lasted much longer than bear markets.
Dollar-cost averaging can help fight the urge to try to time the market.
- 10 stocks we like better than S&P 500 Index ›
Investors have been spoiled over the past few years. The S&P 500 (SNPINDEX: ^GSPC) has nearly doubled since the start of 2023, including three consecutive years of double-digit percentage returns. It's up 12% year to date, so if the momentum continues, we could be in for a fourth consecutive year, something that hasn't happened since 1995 to 1999.
The elephant in the room, however, is investors wondering when they can expect the run to stop and a bear market to happen. We can't predict how the stock market will behave, but considering how stock market cycles work, it's a matter of when, not if, a bear market happens.
Missed Nvidia in 2009? This Rare Signal Is Flashing Again. In 2009, a "Double Down" signal flashed for a little-known chipmaker called Nvidia. For the first time in years, that same "Total Conviction" signal is flashing for a company 1/100th the size of Nvidia. Continue »
Whenever that time comes, investors who stay the course always come out on top.
Image source: Getty Images.
Bear markets are inevitable, though unpredictable
A bear market occurs when a major index, such as the S&P 500 or the Nasdaq Composite, drops by 20% or more from its peak to trough (the bottom of the decline). They luckily don't happen as much as bull markets, but they have been a regular occurrence throughout the stock market's history. Below are five notable bear markets in the past 40 years:
| Bear Market (Ending Year) | S&P 500 Decline | Length (In Days) |
|---|---|---|
| Inflation and rate hikes (2022) | 25.4% | 289 |
| COVID-19 (2020) | 33.9% | 33 |
| The financial crisis (2008) | 51.9% | 408 |
| Dot-com bubble (2001) | 36.8% | 546 |
| Black Monday (1987) | 33.5% | 101 |
Source: First Trust.
The most important thing to note, though, is that the S&P 500 is up nearly 900% since hitting its trough on Dec. 4, 1987, during the Black Monday crash. That's not bad for a broad index like the S&P 500 after experiencing some of the worst bear markets in stock market history.
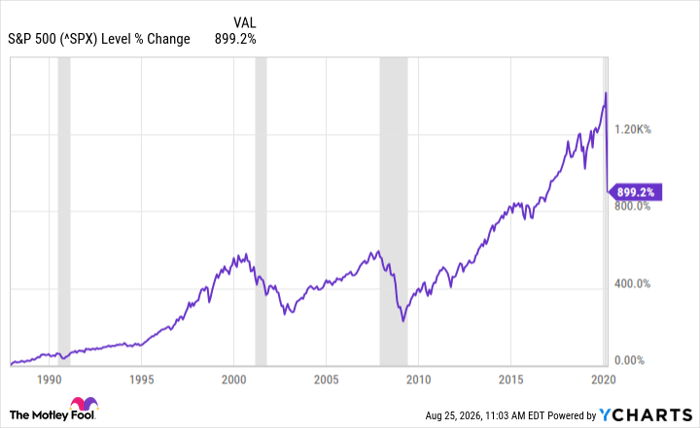
^SPX data by YCharts. Vertical lines represent U.S. recessions.
Past performance doesn't guarantee future performance, but it's encouraging to see the market bounce back time after time.
How I save myself from myself
Staying the course while seeing your investments drop is much easier said than done; I'll be the first to admit it. That's why I personally try to take a dollar-cost averaging approach to investing (particularly with the S&P 500).
When you dollar-cost average, you decide how much you can commit to investing, set an investing schedule, and stick to it regardless of stock prices at the time. For example, if you decide to invest $600 in an S&P 500 ETF, you could commit $150 per week, $300 biweekly, or the full $600 on a specific day.
The exact amount and frequency should ultimately match your financial situation, but the bigger point is staying consistent. You'll inevitably invest when stocks are rising and falling, but history shows it typically works out in your favor because bull markets have lasted much longer than bear markets (4.4 years on average versus 11.1 months).
Should you buy stock in S&P 500 Index right now?
Before you buy stock in S&P 500 Index, consider this:
The Motley Fool Stock Advisor analyst team just identified what they believe are the 10 best stocks for investors to buy now… and S&P 500 Index wasn’t one of them. The 10 stocks that made the cut could produce monster returns in the coming years.
Consider when Netflix made this list on December 17, 2004... if you invested $1,000 at the time of our recommendation, you’d have $439,308!* Or when Nvidia made this list on April 15, 2005... if you invested $1,000 at the time of our recommendation, you’d have $1,286,826!*
Now, it’s worth noting Stock Advisor’s total average return is 964% — a market-crushing outperformance compared to 212% for the S&P 500. Don't miss the latest top 10 list, available with Stock Advisor, and join an investing community built by individual investors for individual investors.
See the 10 stocks »
*Stock Advisor returns as of August 27, 2026.
Stefon Walters has no position in any of the stocks mentioned. The Motley Fool has no position in any of the stocks mentioned. The Motley Fool has a disclosure policy.
Recommended Articles


