


Nvidia Stock Price Forecast: Earnings Beat Expectations Across the Board, Shares Could Reach $300
TradingKey - Nvidia (NVDA)'s latest second-quarter fiscal 2027 results once again beat Wall Street expectations. The company's quarterly revenue reached $96.22 billion, up 106% year-over-year; adjusted EPS was $2.22, higher than the market expectation of around $2.10. Data center revenue reached $89 billion, up 117% year-over-year, also exceeding market expectations. With earnings beating expectations, why did the stock price initially fall before rising in after-hours trading?
Nvidia Earnings Beat Expectations as 70% Future Growth Outlook Becomes Main Catalyst for Stock Price
Based on this earnings report, demand for Nvidia's AI chips continues to maintain high-speed growth. Second-quarter Data Center revenue reached $89 billion, up 117% year-over-year and exceeding the $85.08 billion expected by analysts surveyed by LSEG. The company also expects third-quarter revenue to reach $108 billion ± 2%, significantly higher than the market's previous expectation of around $104.2 billion. In other words, computing power demand from big tech companies, AI labs, and cloud service providers has yet to show any noticeable slowdown.
Vera Rubin has become a key variable for the next phase of growth. Nvidia confirmed that Rubin has begun shipping to customers and expects it to contribute approximately 20% of Data Center revenue in the third quarter. This means the next-generation product cycle following Blackwell has already begun generating actual revenue. For NVDA's stock price, Rubin's smooth ramp-up has eased market concerns about a potential product cycle gap after the end of Blackwell's high-growth period.
However, the earnings report also highlighted a clear pressure point: gross margin may decline. Adjusted gross margin for the second quarter was 75%, but the company expects it to drop to around 74% in the third quarter and potentially fall further to 71%–72% in the fourth quarter, primarily driven by rising memory chip prices and increased costs for other components. This projected decline in gross margin was a key reason why the company's stock price came under pressure in after-hours trading following the release of the earnings report.
What reversed the trajectory of the after-hours stock price, however, was the longer-term growth forecast provided by management, turning an initial after-hours drop into a gain of nearly 5%. Nvidia expects fiscal year 2028 revenue to grow by approximately 70% year-over-year, far above Wall Street's pre-earnings expectation of about 44%. CEO Jensen Huang further stated that if not for supply constraints, the company's revenue next year could even come close to doubling again.
Nvidia Stock Price Technical Analysis
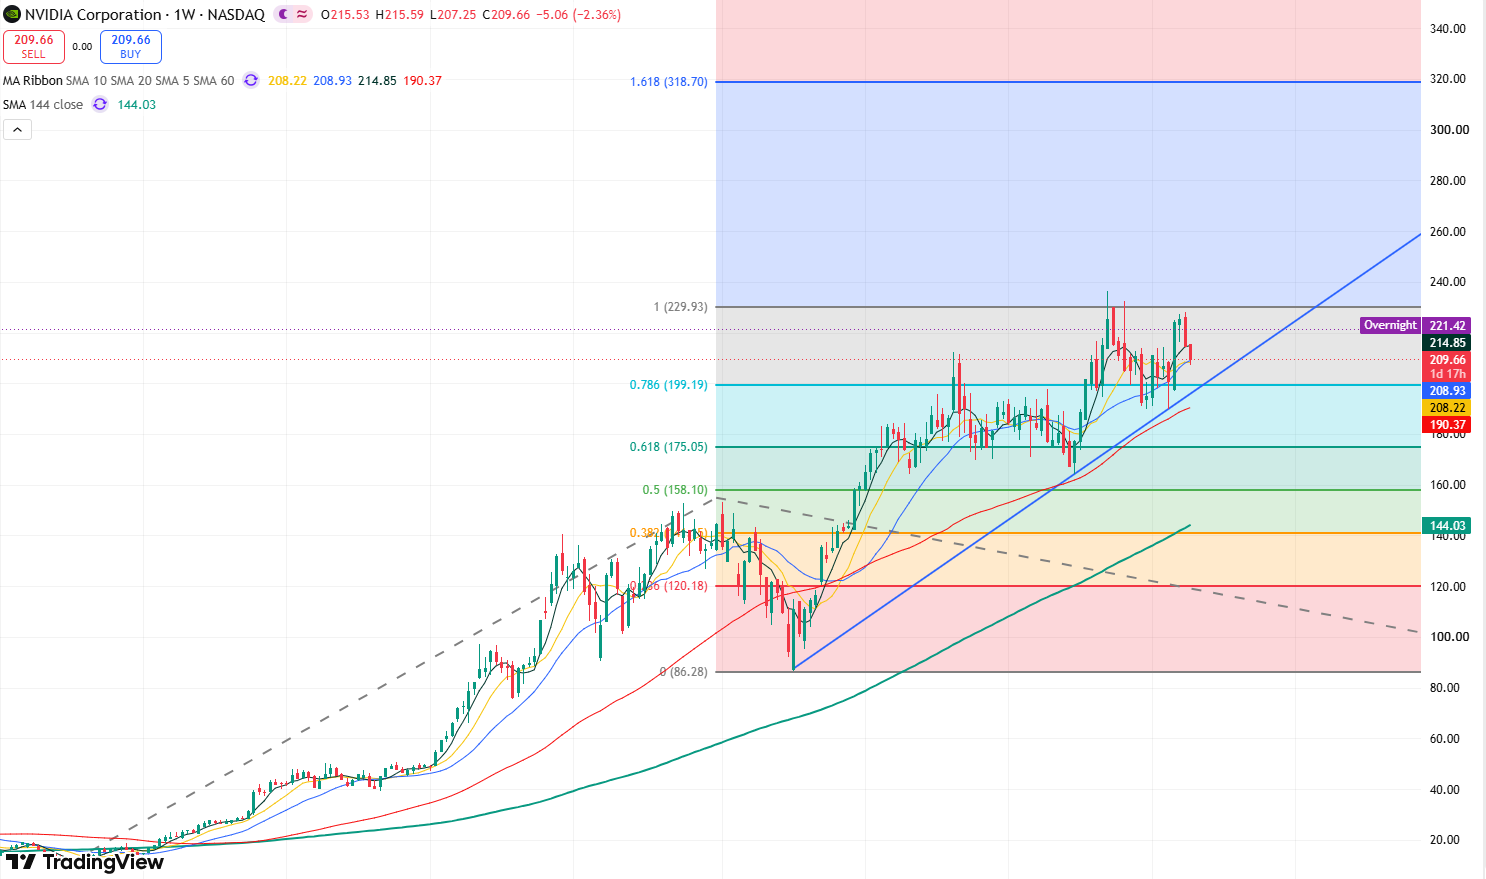
Nvidia weekly stock price chart, Source: TradingView
Judging from Nvidia's weekly stock price chart, the overall trend displays a clear upward trajectory. During recent gains, the stock came under pressure and weakened when retesting the resistance level near $230, softening short-term bullish momentum; however, with Nvidia releasing better-than-expected financial results along with strong future growth expectations, market bullish sentiment has recovered.
On the upside, the primary resistance level to watch above is $228–$230, followed by the historical high of $236.54. A breakout above this level would open up upside room toward the $300 mark.
On the downside, the primary support level to watch below is $207. If it falls below this level, the stock may test the $200 mark, and if this level fails to hold, the price could further drop toward $190.
Recommended Articles


