


Prediction: If a Recession Is Coming, This ETF Will Be the Smartest Investment Right Now
Key Points
This Vanguard ETF provides exposure to virtually all of the U.S. stock market.
It has outperformed the S&P 500 since it first began trading in May 2001.
Investors should avoid trying to time the market because it can be counterproductive.
- 10 stocks we like better than Vanguard Morningstar Total Stock Market ETF ›
According to prediction platform Polymarket, the chances of the U.S. experiencing a recession before the end of this year or the end of 2027 are 8% and 34%, respectively (as of Aug. 25). Only time will tell how it plays out, but one thing remains true: It's always better to be overprepared than underprepared.
Recessions are a natural part of the economic cycle, so it's never too early for investors to position their portfolios accordingly. One of the best investments to own while approaching or during a recession is the Vanguard Morningstar Total Stock Market ETF (NYSEMKT: VTI). It lets you invest in the entire U.S. stock market with a single investment, covering a lot of ground.
Missed Nvidia in 2009? This Rare Signal Is Flashing Again. In 2009, a "Double Down" signal flashed for a little-known chipmaker called Nvidia. For the first time in years, that same "Total Conviction" signal is flashing for a company 1/100th the size of Nvidia. Continue »
There's value in keeping it broad
VTI holds 3,515 stocks covering small-cap, mid-cap, and large-cap, so it's as close to a one-stop shop as you'll find (minus international stocks). Being broad works in VTI's favor during recessions because it reduces reliance on a single industry or market-cap segment.
It first began trading on May 24, 2001, and since then, it has experienced three recessions: the dot-com bubble, the financial crisis, and the COVID-19 pandemic. Still, it has weathered each storm and produced decent gains. VTI's 7.8% average annual returns since its inception aren't eye-popping by any means, but it has still outperformed the S&P 500.
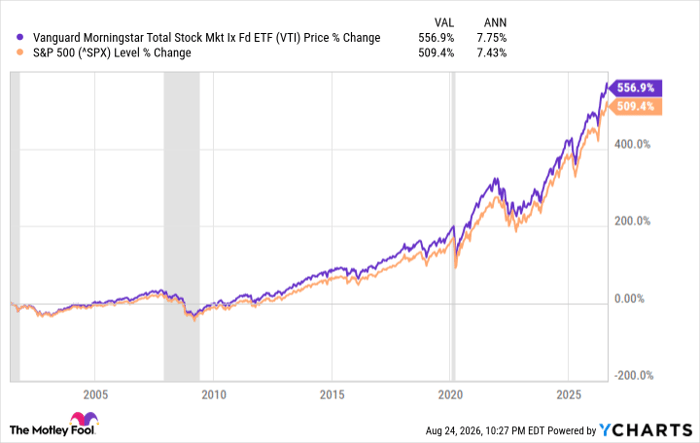
VTI data by YCharts. Vertical grey bars represent U.S. recessions.
Past performance doesn't guarantee future performance, but it's encouraging to see how resilient the U.S. market has been, even through some of the country's worst economic periods.
Why VTI over the S&P 500?
The S&P 500 is an investment I'll always endorse and invest in, but when it comes to recessions, VTI has a slight advantage because it has less concentration risk. Every S&P 500 company is in VTI, but the small-cap and mid-cap companies VTI holds provide exposure to the economy's full recovery potential.
Smaller companies typically experience sharper drops during recessions, but they also tend to rebound faster in the early phases of economic recovery. There are, of course, exceptions to every rule, but that's the general trend that has historically happened.
That doesn't mean it'll continue to happen, but in either case, you can't go wrong with being invested in the U.S. stock market as a whole. The one thing to keep in mind is the importance of staying the course and being consistent.
It can be tempting to try to time the market (like holding off on investing, anticipating a market drop), but that generally doesn't work in an investor's favor because doing so consistently is nearly impossible. Stick with VTI and trust its long-term return potential, recession or not.
Should you buy stock in Vanguard Morningstar Total Stock Market ETF right now?
Before you buy stock in Vanguard Morningstar Total Stock Market ETF, consider this:
The Motley Fool Stock Advisor analyst team just identified what they believe are the 10 best stocks for investors to buy now… and Vanguard Morningstar Total Stock Market ETF wasn’t one of them. The 10 stocks that made the cut could produce monster returns in the coming years.
Consider when Netflix made this list on December 17, 2004... if you invested $1,000 at the time of our recommendation, you’d have $443,461!* Or when Nvidia made this list on April 15, 2005... if you invested $1,000 at the time of our recommendation, you’d have $1,307,633!*
Now, it’s worth noting Stock Advisor’s total average return is 973% — a market-crushing outperformance compared to 213% for the S&P 500. Don't miss the latest top 10 list, available with Stock Advisor, and join an investing community built by individual investors for individual investors.
See the 10 stocks »
*Stock Advisor returns as of August 26, 2026.
Stefon Walters has no position in any of the stocks mentioned. The Motley Fool has no position in any of the stocks mentioned. The Motley Fool has a disclosure policy.
Recommended Articles


