


The Small-Cap Premium Was Supposed to Beat Large Caps Over Time. It Hasn't in 15 Years. Here's the Actual Gap.
Key Points
Small-cap stocks have steadily underperformed large caps for more than a decade.
Poor profitability rates and higher interest rates have contributed to the lag.
But improved earnings growth rates and reasonable valuations could be setting up small-cap stocks for an extended stretch of leadership.
- 10 stocks we like better than iShares Trust - iShares Russell 2000 ETF ›
The idea of a small-cap premium goes back decades. The concept is straightforward: Smaller companies carry more risk, and the markets compensate that higher risk with higher long-run returns. It would be the reasoning behind owning something like the iShares Russell 2000 ETF (NYSEMKT: IWM) alongside a large-cap fund, such as the Vanguard S&P 500 ETF (NYSEMKT: VOO).
There's just one problem. With just a few exceptions, that small-cap premium hasn't materialized for at least 15 years.
Missed Nvidia in 2009? This Rare Signal Is Flashing Again. In 2009, a "Double Down" signal flashed for a little-known chipmaker called Nvidia. For the first time in years, that same "Total Conviction" signal is flashing for a company 1/100th the size of Nvidia. Continue »
The following chart shows small-cap stock performance relative to large-cap stocks over this time frame. If investors were earning a small-cap premium, you'd expect this trendline to be moving up. Instead, it's been trending down for years.
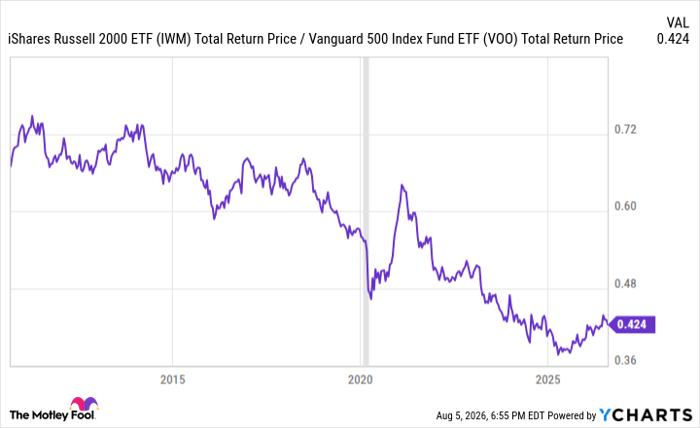
Data by YCharts.
With this type of recent underperformance coupled with an anticipated acceleration in earnings, the opportunity in small-cap stocks could be huge.
Why small caps have lagged large caps for so long
Since the Vanguard S&P 500 ETF launched in 2010, it has gained 830%, far surpassing the 490% return of the iShares Russell 2000 ETF.
There are a few reasons the small-cap premium has disappeared.
- Lower profitability: Roughly 40% of Russell 2000 components are currently unprofitable. More broadly, earnings growth for smaller companies was lower due to higher interest rates, which disproportionately affect debt-heavy small-cap stocks, and the emergence of mega-cap tech as an economic driver.
- Rate sensitivity: Small caps are disproportionately affected by higher interest rates due to higher debt levels to fund operational needs. The U.S. economy went through two major rate-hiking cycles over the past decade.
- Passive fund flows favoring large caps: The growth of index investing, S&P 500 ETFs, and other cap-weighted products has disproportionately pushed a lot of investor capital into just a handful of stocks.

Image source: Getty Images.
Why the small-cap premium could soon return
The macro environment for small caps has begun turning the corner. Megacap tech companies were the first big beneficiaries of the artificial intelligence boom, but now smaller companies are beginning to see the benefits too.
Small-cap earnings are expected to grow 18% in both 2026 and 2027, surpassing the forecasted earnings growth of the S&P 500 for the first time in years. With valuations already considerably lower, the risk/reward profile of small caps looks substantially better today than it did a year or two ago.
We've already seen what can happen when megacaps lose their momentum. The iShares Russell 2000 ETF is outperforming by 8% year-to-date, thanks to improved earnings growth. If large caps begin to see their AI-driven growth rates slow or peak, the rotation into more reasonably valued small caps could continue.
Market leadership goes in cycles. We see it in U.S. vs. international stocks and large caps vs. small caps. Outperformance from one group doesn't last forever. For small caps, the time for a rotation may be approaching.
Should you buy stock in iShares Trust - iShares Russell 2000 ETF right now?
Before you buy stock in iShares Trust - iShares Russell 2000 ETF, consider this:
The Motley Fool Stock Advisor analyst team just identified what they believe are the 10 best stocks for investors to buy now… and iShares Trust - iShares Russell 2000 ETF wasn’t one of them. The 10 stocks that made the cut could produce monster returns in the coming years.
Consider when Netflix made this list on December 17, 2004... if you invested $1,000 at the time of our recommendation, you’d have $419,408!* Or when Nvidia made this list on April 15, 2005... if you invested $1,000 at the time of our recommendation, you’d have $1,348,694!*
Now, it’s worth noting Stock Advisor’s total average return is 966% — a market-crushing outperformance compared to 213% for the S&P 500. Don't miss the latest top 10 list, available with Stock Advisor, and join an investing community built by individual investors for individual investors.
See the 10 stocks »
*Stock Advisor returns as of August 19, 2026.
David Dierking has no position in any of the stocks mentioned. The Motley Fool has positions in and recommends Vanguard S&P 500 ETF. The Motley Fool has a disclosure policy.
Recommended Articles


