


AMD Triangle Breakout Targets $530 as MI450 Ramp Accelerates — Will Jackson Hole Validate the Rally?
TradingKey - Advanced Micro Devices (AMD) has most of the qualities of a bullish stock. It’s currently trading above its symmetrical triangle, and this pattern suggests further upside. If AMD breaks above this resistance, it’ll be heading towards the $530.39 area. This is a good fundamental signal as the company beat analyst estimates for Q2 with an impressive 50% growth. More importantly, the Data Center division grew by an astounding 107% from this time last year.
New client deployments of AMD’s Mi450 accelerator are coming from Anthropic (raised $ 5 billion for AMD GPUs), Oracle (expecting 50,000 deployments by the end Q3), and continued buildouts from Amazon, Meta, and OpenAI. AMD is trading with a multi-year forward P/E of around 47. While it’s too early for a stock with little wiggle room (assuming no new negative sentiment) to hit that valuation, the stock’s price action is somewhat justified.
For now, expectations for volatile runoff and Jackson Hole 2022 are building anticipation for this company. Of course, the strongest fundamental signal will need to be the first sign of a potential trade. AMD’s price action will heavily depend on Jackson Hole. If the Fed beats expectations for runoff and suggests the economy is still strong enough to sustain AI funding, then bullish signaling is likely to persist and continue to push AMD prices past $530. Conversely, uncertain Fed communication regarding AI will likely spell consolidation for AMD stock.
Anthropic $5B Funding + 2GW Commitment: Fresh Demand Signal
The most important recent development is Anthropic's announcement that they have $5 billion in funding, and a significant portion of this will be allocated to purchasing AMD GPUs. According to the reports, the deal is for 2 gigawatts of capacity, which is the capacity that Meta and Amazon have collectively committed. This matters, as Anthropic is one of the most advanced AI labs and is not a capital constrained startup. This affirms the technical usability of MI450 for training and inference at scale.
Oracle 50,000 MI450 Units: Enterprise Validation, Not Just Hyperscaler Hype
Oracle has indicated that it will begin rolling out 50,000 MI450 accelerators across its cloud infrastructure during Q3 of 2026. Enterprise validation is stronger than focusing only on the hyperscale market, and as such, this is a significant announcement. If enterprises are ordering in the thousands, then MI450 must have feature parity with NVIDIA in the enterprise market. In addition, Oracle is not a startup. It is a $300B company, and if it has engineering and capital discipline as well as the confidence to back MI450, then this is an even stronger indication.
The Valuation Question: 47x Forward P/E Assumes Flawless Execution
AMD's valuation currently is a reflection of extraordinary optimism for MI450 adoption and sustained capex through 2027. Currently, at 47x, the stocks offer little wiggle room for disappointment. If there is a sluggish MI450 ramp, increased competitive pressure from NVIDIA, or if there is a slowdown in capex cycles, then the stocks could be adversely impacted.
Why Jackson Hole Matters:
The commentary from the FOMC could be very important to the valuations of tech stocks. Validation of the economy would support upside. However, growth would be an indication of a slow down in the economy and the shift from growth stocks to defensive stocks would mean a rotation out of technology.
Competitive Dynamics: NVIDIA Still Dominant, But AMD Gaining Share
Among training AI accelerators, NVIDIA still holds 80-85 percent share of the market, with AMD having 10-12 percent, leaving a small percentage to Graphcore, Cerebras, and others. NVIDIA’s market share will not be affected by AMD, but their partnerships with Anthropic and Oracle demonstrate that they do manage to win client contracts in enterprise and the AI-Lab segment, which is more reliant on differentiation and client relationships.
NVIDIA faces some supply chain challenges and if they were to impact NVIDIA customers, clients could likely begin to use AMD's MI450 instead. Constraint-centered demand shifts will affect competition long before R & D.
Technical Setup: Triangle Breakout Confirmed, $530 Resistance Back in Focus
Price on the 2-hour chart of AMD has broken out above the upper bound of a multi-week symmetrical triangle after price recovered from $455-$460 support. Price is now around $514.49 and has moved above both the moving averages ($491.11 and $496.93) and horizontal resistance at $499.35. Stronger price momentum is shown by the RSI, which has reached about 66 and is above the $54 signal line.
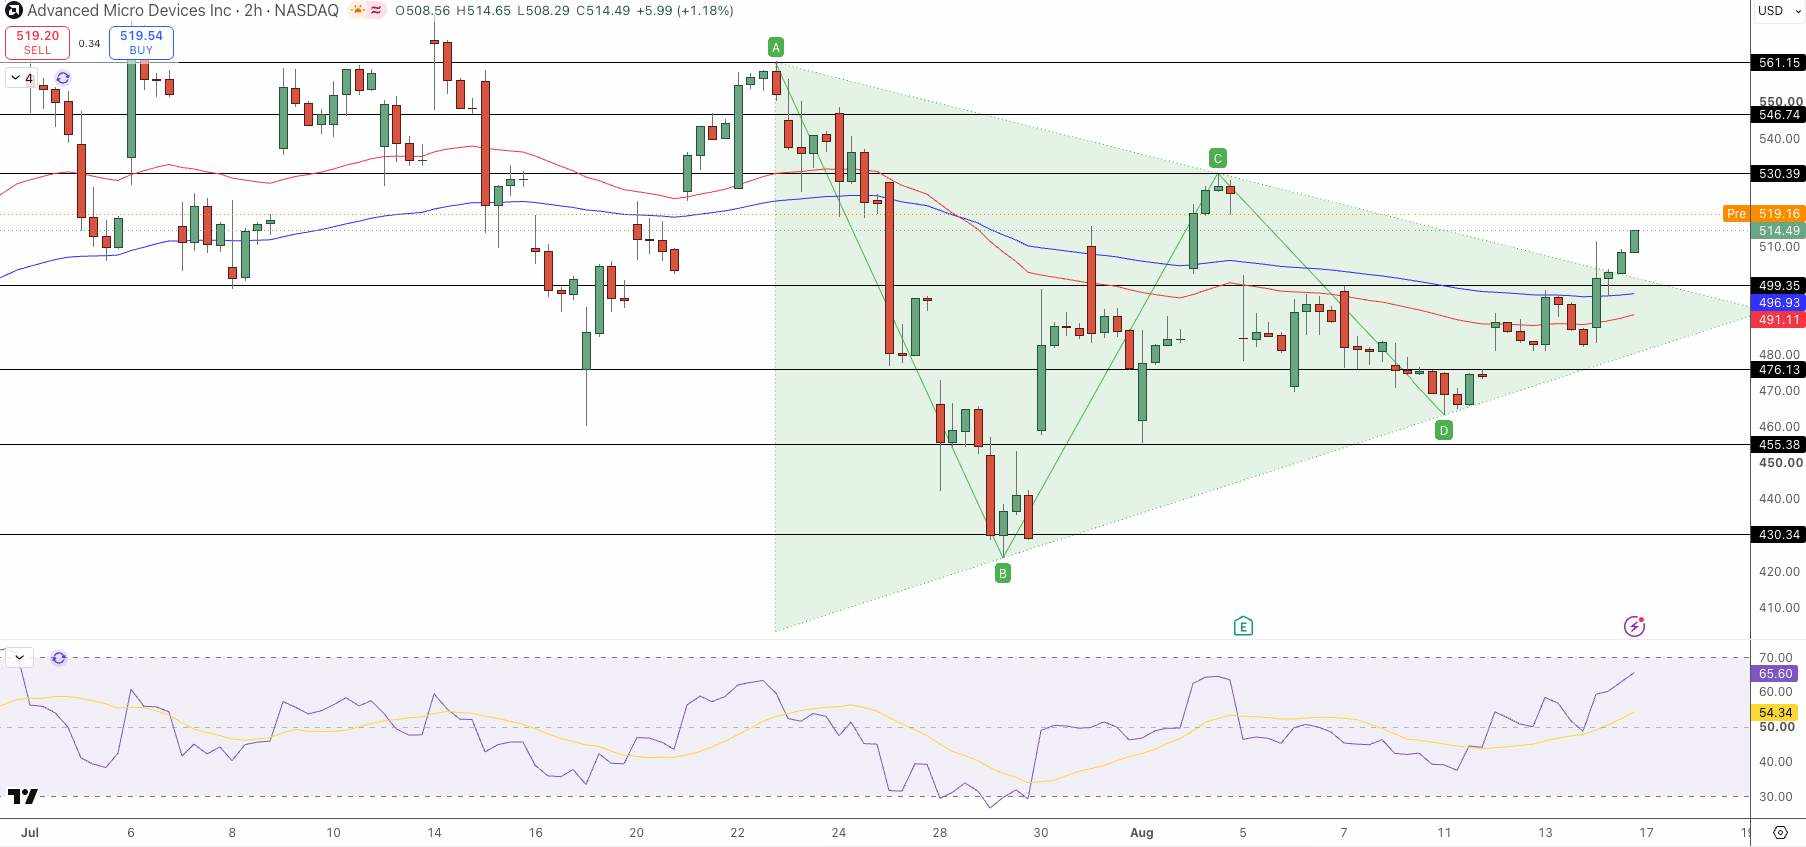
AMD Price Chart - Source: Tradingview
The next major price level is likely $530.39 (previous C swing high). An upside break of $530 exposes resistance levels around $546.74 and $561.15. Breakout failure puts resistance at the 50-EMA at $491.11 and could create a price drop to $476.13.
Bottom Line
AMD posted impressive numbers for Q2: $11.536B (+50%), Data Center: $6.7B (+107%), EPS: $1.66 beat expectations. Exceeding expectations and with the recent signings of deals and contracts, the MI450 is looking to maintain its current pace for ramping. AMD recently signed a 10-year large commitment with Anthropic to secure $5B and deliver 2 GW. Oracle is looking to procure 50k units starting in their fiscal Q3. The Meta/Open AI capacity deal is looking to maintain. AMD is releasing solid guidance for Q3 in the range of $13.0B with +/- $300M of flexibility, showing confidence in their ability to deliver.
Valuing AMD at 47x forward P/E seems steep, but if the MI450 is able to keep the ramp going and if capex can sustain, this becomes justified. After Jackson Hole (Aug 21-22), things will be clearer if the Fed loses confidence from this event that would keep them at the lower end-range, resulting in a breakdown and drawing down toward $530-561. However, if the Fed is confident from Jackson Hole, this would result in a breakout and lead us to the upper end of the range.
Breakout of Triangle confirmed, en route to $530. Bias is bullish as long as support at $499.35 is maintained. If $491.11 is broken, the structure of the recovery will break down. This is for informational purposes only and should not be taken as investment advice.
Recommended Articles


