


CVS Health Corp Stock (CVS) Moved Down by 3.46% on Aug 17: A Full Analysis
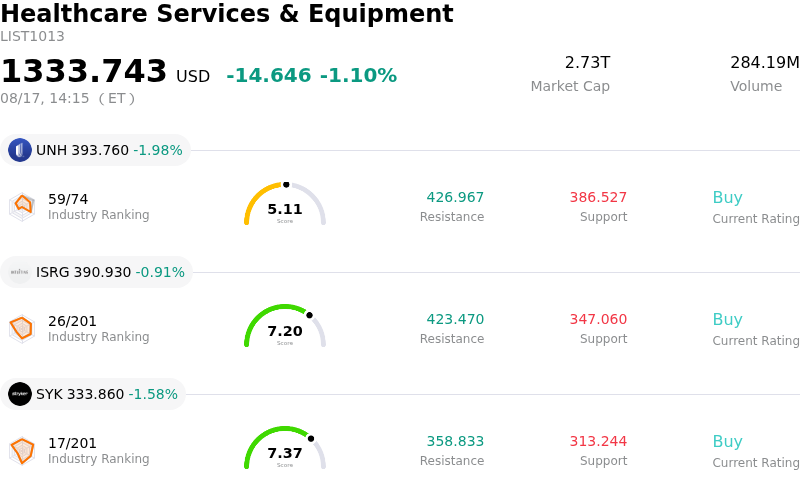
CVS Health Corp (CVS) moved down by 3.46%. The Healthcare Services & Equipment sector is down by 1.10%. The company underperformed the industry. Top 3 stocks by turnover in the sector: Unitedhealth Group Inc (UNH) down 2.01%; Intuitive Surgical Inc (ISRG) down 0.91%; Stryker Corp (SYK) down 1.58%.
What is driving CVS Health Corp (CVS)’s stock price down today?
CVS Health experienced noticeable selling pressure and intraday volatility as market sentiment continues to digest mixed forward-looking signals following its recent quarterly operational updates. Although the company recently delivered a strong quarterly performance and raised its full-year earnings guidance, investors remain cautious regarding lingering operational and structural headwinds. The downward trajectory reflects heightened scrutiny around second-half medical cost trends and potential earnings deceleration across key operating segments.
A primary source of investor apprehension stems from management commentary pointing to persistent cost trends within the Health Care Benefits segment and longer-term friction in the Caremark pharmacy benefit management unit. While CVS strengthened its near-term financial outlook, management cautioned that second-half performance could face pressure from elevated healthcare utilization rates and macro uncertainties. Furthermore, structural changes in the Caremark business, including shifts away from traditional rebate negotiations toward net-cost pricing models, are projected to create membership and client retention challenges. Additional operational hurdles, such as ongoing margin pressure within the 340B drug discount program as manufacturers restrict participation, continue to weigh on forward visibility.
From a broader market perspective, health insurance and pharmacy service providers face ongoing regulatory scrutiny and changing industry dynamics. While institutional investors acknowledge the margin recovery in the Aetna unit, valuation multiples remain sensitive to any uncertainty regarding multi-year margin sustainability. The combination of conservative second-half growth expectations and emerging structural shifts in pharmacy benefits has prompted investors to adopt a cautious stance, triggering selling pressure and volatility.
Technical Analysis of CVS Health Corp (CVS)
Technically, CVS Health Corp (CVS) shows a MACD (12,26,9) value of -2.245, indicating a sell signal. The RSI at 40.546 suggests neutral condition and the Williams %R at 75.574 suggests sell condition. Please monitor closely.
Media Coverage of CVS Health Corp (CVS)
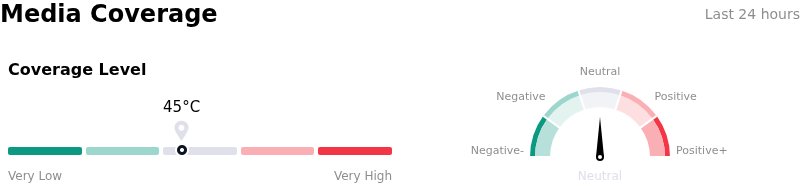
In terms of media coverage, CVS Health Corp (CVS) shows a coverage score of 45, indicating a moderate level of media attention. The overall market sentiment index is currently in neutral zone.
Fundamental Analysis of CVS Health Corp (CVS)
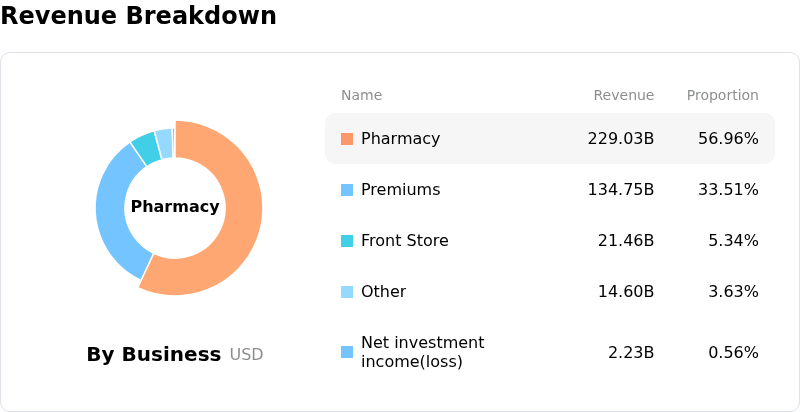
CVS Health Corp (CVS) is in the Healthcare Services & Equipment industry. Its latest annual revenue is $402.07B, ranking 2 in the industry. The net profit is $1.77B, ranking 5 in the industry. Company Profile
Over the past month, multiple analysts have rated the company as Buy, with an average price target of $112.53, a high of $126.00, and a low of $79.00.
More details about CVS Health Corp (CVS)
Company Specific Risks:
- Elevated Utilization and Medical Benefit Ratio Pressure: Persistent medical cost inflation within the Aetna Health Care Benefits segment continues to drive elevated medical benefit ratios, creating downside risk for Medicare Advantage underwriting margins.
- 2027 Growth Scrutiny and Margin Recovery Execution: Analyst commentary highlighting that preliminary outlooks for 2027 profits undercut expectations has triggered intraday selling, reflecting skepticism over the pace of Aetna's multi-year margin recovery.
- Legislative and Regulatory Overhang on PBM Services: Ongoing Congressional PBM reform efforts and FTC scrutiny regarding CVS Caremark's drug pricing and reimbursement structures threaten core fee revenue and operational flexibility.
- Substantial Leverage and Long-Term Debt Burden: Recent Form 10-Q filings disclose over $61 billion in total debt ($59.45 billion long-term), keeping financial leverage elevated and constraining capital allocation for share buybacks or debt paydown.
Recommended Articles


