


Teradyne Inc Stock (TER) Moved Up by 5.67% on Aug 17: Facts Behind the Movement
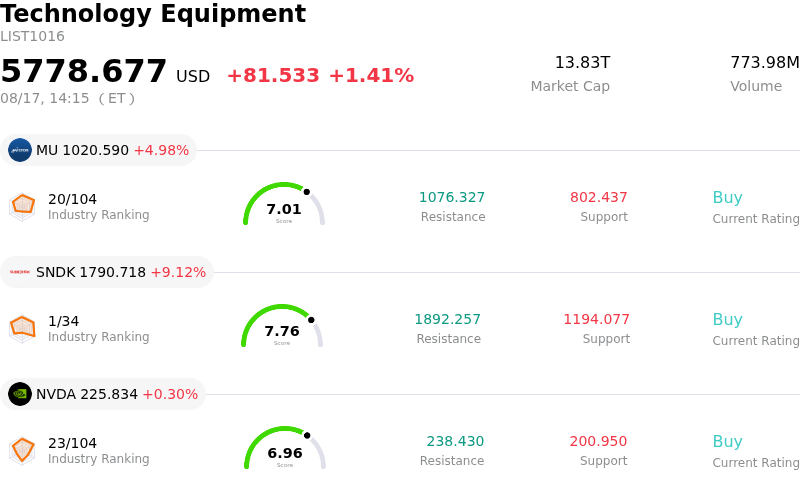
Teradyne Inc (TER) moved up by 5.67%. The Technology Equipment sector is up by 1.41%. The company outperformed the industry. Top 3 stocks by turnover in the sector: Micron Technology Inc (MU) up 4.98%; SanDisk Corporation (SNDK) up 9.07%; NVIDIA Corp (NVDA) up 0.30%.
What is driving Teradyne Inc (TER)’s stock price up today?
Teradyne experienced notable upward momentum today, driven primarily by sustained tailwinds across the semiconductor automated test equipment market. Demand for advanced testing solutions continues to be bolstered by the rapid expansion of artificial intelligence applications, high-bandwidth memory architectures, and complex system-on-chip platforms. As chip manufacturers deploy increasingly sophisticated silicon architectures for data centers and high-performance computing, the need for rigorous testing and validation has intensified, directly benefiting leading equipment providers.
The positive stock performance reflects strong underlying fundamental momentum following impressive quarterly financial results and subsequent positive earnings estimate revisions. Wall Street analysts have highlighted Teradyne's robust margin profile, top-line execution, and accelerating demand within its Semiconductor Test division. Continuous upward revisions to forward earnings forecasts have energized institutional investors, encouraging capital inflows into high-conviction technology capital equipment names.
Beyond core semiconductor testing, the company's multi-pronged strategy provides structural diversification. Stable performance within its Industrial Automation segment, particularly through collaborative robotics and automated inspection systems, helps offset cyclical broader hardware swings. While overall equity market sentiment remains sensitive to broader macroeconomic data and intraday volatility across the semiconductor ecosystem, solid execution and expanding backlogs in AI-related hardware continue to provide strong support for the equity.
Technical Analysis of Teradyne Inc (TER)
Technically, Teradyne Inc (TER) shows a MACD (12,26,9) value of 14.045, indicating a buy signal. The RSI at 60.341 suggests neutral condition and the Williams %R at 2.910 suggests overbought condition. Please monitor closely.
Media Coverage of Teradyne Inc (TER)
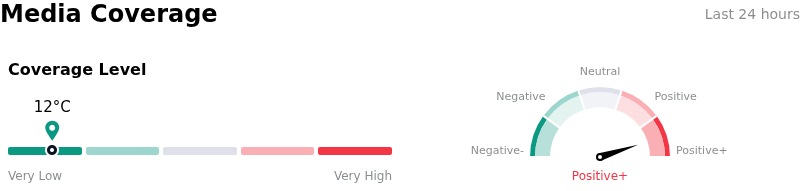
In terms of media coverage, Teradyne Inc (TER) shows a coverage score of 12, indicating a very low level of media attention. The overall market sentiment index is currently in extremely bullish zone.
Fundamental Analysis of Teradyne Inc (TER)
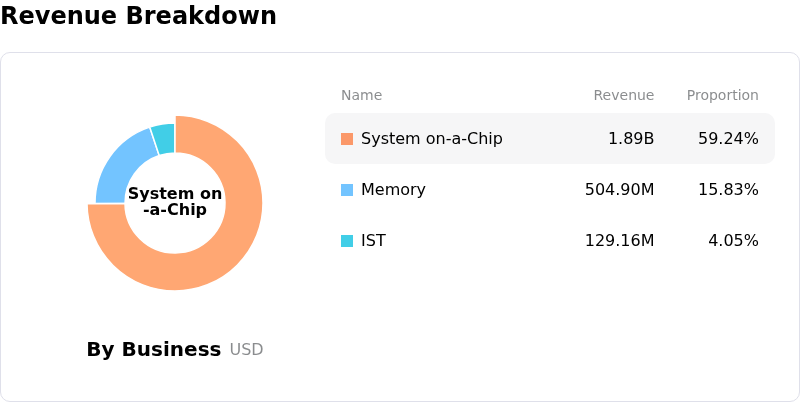
Teradyne Inc (TER) is in the Technology Equipment industry. Its latest annual revenue is $3.19B, ranking 30 in the industry. The net profit is $554.05M, ranking 23 in the industry. Company Profile
Over the past month, multiple analysts have rated the company as Buy, with an average price target of $432.02, a high of $550.00, and a low of $270.00.
More details about Teradyne Inc (TER)
Company Specific Risks:
- Accelerated Corporate Insider Selling: Form 144 and Form 4 SEC filings on August 17, 2026, revealed continued share liquidations by corporate insiders, including CEO Gregory S. Smith's planned sale of $1.7 million in common stock and Director Marilyn Matz's filing for a $510,000 sale, heightening investor concern over insider profit-taking at current valuation peaks.
- Credit Facility & Debt Covenant Constraints: Recent SEC Form 8-K disclosures detailing updated credit agreement terms, including Investment Grade Suspension Period conditions and leverage ratio restrictions, highlight increased capital structure sensitivity and potential liquidity risks if debt service coverage metrics come under pressure.
- Extreme Valuation Premium and Volatility Sensitivity: Trading at a trailing price-to-earnings multiple exceeding 50x following a massive year-to-date price rally, the stock carries an ultra-expensive valuation grade that leaves it exceptionally vulnerable to profit-taking sell-offs during chip sector drawdowns.
- High Customer Concentration in AI Infrastructure Spending: With AI-related demand accounting for over 60% of total company revenues, earnings visibility is heavily exposed to the capital expenditure cycles of data center hyperscalers, creating fundamental vulnerability if AI test equipment demand decelerates.
Recommended Articles


