


Uh-Oh! The Inflationary Effects of the Donald Trump-Led Iran War Now Extend Well Beyond the Energy Sector.
Key Points
Statistically, outsize annualized returns have been the norm for the Dow Jones Industrial Average, S&P 500, and Nasdaq Composite under President Donald Trump.
Trump's decision to attack Iran sent fuel prices soaring -- but energy is no longer the primary concern from Iran-war-driven inflation.
Trumpflation has entered a new phase, with the inflationary effects of the Iran war spilling over into the broader economy.
- 10 stocks we like better than S&P 500 Index ›
Statistically, an outperforming stock market and Donald Trump in the White House have gone hand in hand. During President Trump's first, non-consecutive term, the time-tested Dow Jones Industrial Average (DJINDICES: ^DJI), widely followed S&P 500 (SNPINDEX: ^GSPC), and technology-focused Nasdaq Composite (NASDAQINDEX: ^IXIC) rallied 57%, 70%, and 142%, respectively.
These outsize annualized returns have continued since his second term began, with the evolution of artificial intelligence (AI) serving as the primary catalyst.
Missed Nvidia in 2009? This Rare Signal Is Flashing Again. In 2009, a "Double Down" signal flashed for a little-known chipmaker called Nvidia. For the first time in years, that same "Total Conviction" signal is flashing for a company 1/100th the size of Nvidia. Continue »

The inflationary effects of President Trump's Iran war could stick around considerably longer than initially forecast. Image source: Official White House Photo by Daniel Torok.
However, not all of Donald Trump's policies are well-received by Wall Street and/or consumers. For example, his tariff and trade policy, designed to bolster U.S. manufacturing jobs, is adding duties to select imported goods and driving up consumer prices.
But in the grand scheme of things, Trump's tariffs are peanuts relative to the impact the Iran war is having on U.S. inflation. Although energy has been the headline story over the first five-plus months of this Middle East conflict, we're witnessing an evolution of Trumpflation, which now extends well beyond the energy sector. That's terrible news for the president and Wall Street.
The Iran war represents the largest energy supply disruption in modern history
Shortly after President Trump green-lit military operations against Iran, the latter shut down the Strait of Hormuz to most commercial vessels. This action effectively halted the flow of approximately 20 million barrels of petroleum liquids, representing a fifth of global demand. It's the largest energy supply disruption in modern history.
Removing a fifth of the world's crude oil supply in the blink of an eye had a notable impact on energy markets. Within a matter of weeks, crude oil prices surged more than 70%, with fuel prices following suit. Gas prices rose at the fastest pace in more than three decades.
⛽ Average U.S. gas prices per gallon on May 6, per AAA:
-- NBC News (@NBCNews) May 6, 2026
• Regular: $4.54 (⬆️ $1.56 since war in Iran began on Feb. 28)
• Premium: $5.39 (⬆️ $1.85 since war began)
• Diesel: $5.67 (⬆️ $1.81 since war began)
For consumers driving gas- and diesel-powered vehicles, the impact of the Iran war on their pocketbooks was impossible to miss. Between February and May, trailing 12-month (TTM) inflation surged from 2.4% to a three-year high of 4.2% -- more than double the Federal Reserve's long-term inflation target of 2%.
Consumers have enjoyed a modest reprieve over the previous two months as crude oil prices have eased amid hope for peace talks between the U.S. and Iran. Unfortunately, fuel prices tend to rise like a rocket when energy supply chains are disrupted and fall like a feather once these issues are resolved. This means a peace deal that reopens the Strait of Hormuz won't immediately reduce the higher fuel prices consumers have been paying.
While President Trump has insisted that inflation will plunge once the Iran war ends, evidence is mounting that the inflationary effects of this conflict are spilling over into the broader economy. If accurate, this may prove devastating to Wall Street's historic bull market rally.
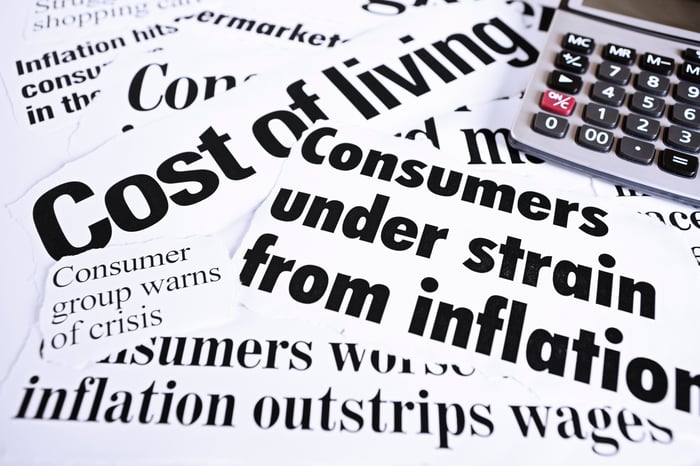
Image source: Getty Images.
Trumpflation is entering a new stage, which is bad news for consumers and the stock market
Although there have been select bright spots concerning inflation, such as TTM inflation for June falling to 3.5% from 4.2% in May, Core Personal Consumption Expenditures (PCE) serves as a glaring warning for consumers, the president, and Wall Street that Iran-war-driven inflation has entered its next phase.
Core PCE, which is one of the Federal Reserve's favorite inflationary measures, excludes volatile food and energy costs. In May, Core PCE reached 3.4%, representing its highest level since October 2023. Whereas the Federal Reserve Bank of Cleveland's Inflation Nowcasting tool is forecasting a steady decline in headline inflation from a reported 4.2% in May to an estimated 3.22% in August, its projection for Core PCE is that prices remain sticky. The Cleveland Fed's August forecast calls for Core PCE to inch back to 3.36%.
BREAKING: US June PCE inflation, the Fed's preferred inflation metric, falls to 3.7%, in-line with expectations.
-- The Kobeissi Letter (@KobeissiLetter) July 30, 2026
Core PCE inflation fell to 3.3%, the second highest reading since October 2024.
US inflation continues to run at nearly double the Fed's 2% target.
What this projection tells us is that energy prices aren't the primary catalyst for Iran-war-driven inflation any longer. Several other factors are impacting consumer prices:
- Businesses are altering shipping routes, changing suppliers, and/or shifting transportation type (air, railroad, or truck instead of maritime), which are increasing costs that are passed on to consumers.
- In addition to the Strait of Hormuz being a major energy chokepoint, around a third of the world's fertilizer passes through this narrow channel. Fertilizer shortages can reduce crop yields and increase costs in supermarkets for consumers.
- Petroleum-based products, such as synthetic polymers and plastics, have surged in cost, leading businesses to pass along these expenses to their customers.
- The Iran war has disrupted helium production, which is a necessary cooling and purging agent used by chip fabricators. Qatar supplies more than a third of the world's refined helium.
These shifts represent just some of the impacts outside the energy sector that are driving inflation higher. More importantly, unlike energy supply disruptions, factors that can impact Core PCE tend to be longer-lasting. In other words, Trumpflation is becoming more entrenched over time.
The price stickiness exhibited by Core PCE suggests that Federal Reserve policymakers may not be able to sit idly by and wait/hope for inflation to come down. If the Federal Open Market Committee (FOMC) is forced into action and raises interest rates to stabilize prices, it could mark the end of the Dow's, S&P 500's, and Nasdaq Composite's eyepopping rallies.
Making borrowing costlier for the companies funding the AI infrastructure build-out with debt can slow this expansion and force a rerating of premium AI stock valuations (i.e., the companies primarily responsible for lifting the broader market).
The evolution of Trumpflation, as evidenced by Core PCE, is a wake-up call for Wall Street and FOMC policymakers.
Should you buy stock in S&P 500 Index right now?
Before you buy stock in S&P 500 Index, consider this:
The Motley Fool Stock Advisor analyst team just identified what they believe are the 10 best stocks for investors to buy now… and S&P 500 Index wasn’t one of them. The 10 stocks that made the cut could produce monster returns in the coming years.
Consider when Netflix made this list on December 17, 2004... if you invested $1,000 at the time of our recommendation, you’d have $399,832!* Or when Nvidia made this list on April 15, 2005... if you invested $1,000 at the time of our recommendation, you’d have $1,374,595!*
Now, it’s worth noting Stock Advisor’s total average return is 968% — a market-crushing outperformance compared to 215% for the S&P 500. Don't miss the latest top 10 list, available with Stock Advisor, and join an investing community built by individual investors for individual investors.
See the 10 stocks »
*Stock Advisor returns as of August 9, 2026.
Sean Williams has no position in any of the stocks mentioned. The Motley Fool has no position in any of the stocks mentioned. The Motley Fool has a disclosure policy.
Recommended Articles


