


Gold Price Forecast: Cooling Fed Rate Hike Expectations Boost Appeal as Price May Hit $4,500?
Tradingkey - Spot gold ( XAUUSD) surpassed the $4,350 mark on August 7 Eastern Time and is heading toward $4,400. This also marks the first time gold has returned to this price level since June 17.
Looking at the direct factors driving the rise in gold prices, it was triggered by the cooling of the US July non-farm payrolls data. However, there are still other key factors to watch, which will determine whether this gold rally is a rebound or a trend reversal.
Gold Appeal Boosted as Fed Rate Hike Expectations Cool After Non-Farm Payrolls Unexpectedly Turn Negative
According to data released by the U.S. Bureau of Labor Statistics on Friday, U.S. nonfarm payrolls fell by 23,000 in July, not only significantly missing market expectations of an 80,000 increase but also coming in below the lower bound of all economists' forecasts, marking the worst performance so far this year.
The jobs report suggests that the labor market may have begun to come under pressure under the dual squeeze of uncertainty from the war in Iran and rising price pressures, even though previously resilient consumer demand had supported some employers' hiring intentions.
Following the release of the data, traders quickly scaled back bets on a Federal Reserve rate hike in 2026. U.S. stock index futures jumped immediately, while Treasury yields fell in tandem. The market now expects that the Fed may postpone its originally planned September rate hike.
The logic behind the rise in gold prices is as follows: falling expectations of Federal Reserve rate hikes mean that the risk-free rate and Treasury yields are likely to head lower in the future. Gold itself yields no interest, so when investors hold gold, they forgo the returns of interest-bearing assets like deposits and bonds; as interest rates fall, this opportunity cost decreases, raising the relative appeal of gold. At the same time, expectations of low interest rates tend to weigh on the U.S. dollar, which also boosts demand for dollar-denominated gold allocations, thereby driving up gold prices.
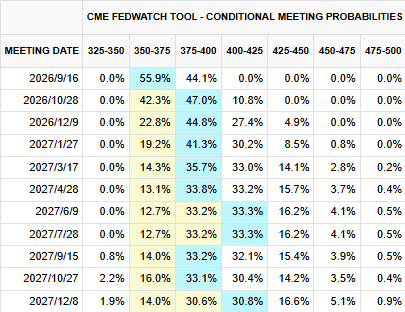
Source: CME Group
Federal Reserve officials need to carefully weigh inflation risks against a weakening labor market, and this data undoubtedly adds complexity to policy decision-making. According to the CME FedWatch Tool, the futures market currently prices in a 44.1% probability of a 25-basis-point rate hike by the Fed in September, down from before the data release.
Gold’s Long-Term Allocation Value Rises
An inadvertent comment by Federal Reserve Chairman Kevin Warsh at a press conference is revealing an unsettling reality to the market: major global central banks are gradually losing control over the bond market, and the ultimate beneficiary of this process may only be gold.
An inadvertent comment by Federal Reserve Chairman Kevin Warsh at a press conference is revealing an unsettling reality to the market: major global central banks are gradually losing control over the bond market, and the ultimate beneficiary of this process may only be gold.
Currently, the yen falling to a 40-year low, the Bank of Japan's rate hikes triggering the unwinding of carry trades, and long-term U.S. Treasury yields rising under market selling pressure collectively underscore the structural pressures facing the global bond market.
Japanese institutions selling U.S. dollar assets to cope with exchange rate and capital repatriation demands have put simultaneous pressure on U.S. stocks and Treasury bonds; meanwhile, Fed Chairman Warsh's remarks about the market independently raising expectations for the entire Treasury yield curve have also been interpreted as a signal of the central bank's marginally weakening influence over long-term interest rates.
In this environment, the long-term allocation value of gold is rising. Gold does not depend on any sovereign credit, and its value is not predicated on a government's debt-paying ability or the effectiveness of central bank policies. When debt expansion forces monetary policy into a difficult balancing act between combating inflation and maintaining fiscal sustainability, measures such as quantitative easing to depress yields may further dilute the purchasing power of fiat currencies.
For most investors, the significance of gold goes beyond short-term price fluctuations; rather, it provides portfolios with an asset option to hedge against currency debasement, sovereign credit risk, and rising stock-bond correlations.
Gold Price Forecast: Return to $4,500 Expected
Spot gold is last reported at $4,352, with the price having effectively broken through the 0.786 Fibonacci retracement level ($4,288.345) and climbed above the 80-day moving average. This implies that the rebound, which was previously merely an oversold recovery, is now evolving into a medium-term trend improvement; short-term bulls have taken control.
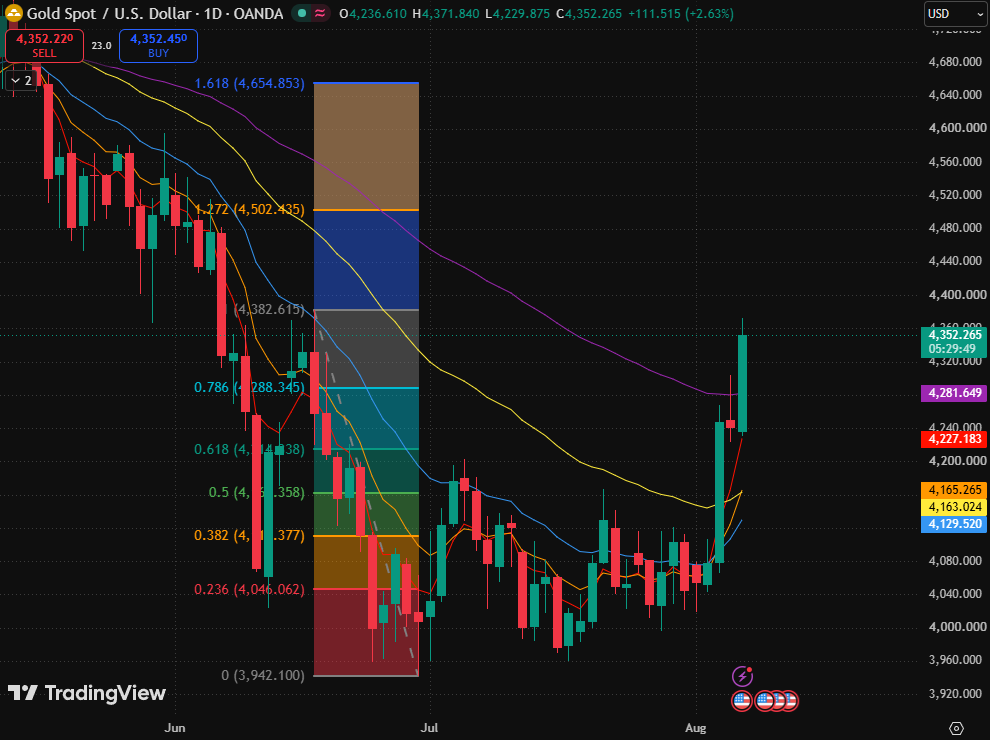
Spot gold candlestick chart, Source: TradingView
It should be noted that the current gold price is approaching the 1 Fibonacci retracement level ($4,382.615), which corresponds to the complete recovery threshold of the previous downward wave; if a consecutive closing breakout cannot be established here, high-level volatility may still occur in the short term.
Short-term primary support has shifted upward to the 0.786 Fibonacci retracement level ($4,288.345), forming a support confluence with the 80-day moving average. As long as the daily close remains above this region, the current breakout structure is expected to continue.
In terms of upside potential, watch whether the interim high of $4,382.615 can be breached; if it is effectively secured, the next target will point to the 1.272 Fibonacci extension level ($4,502.435), with stronger resistance located at the 1.618 Fibonacci extension level ($4,654.853).
Only by holding steady above $4,288 and further breaking through $4,382.615 can it more strongly confirm that gold prices have transitioned from a rebound into a medium-term upward structure.
Recommended Articles


