


US Treasury yields drop on soft NFP, Hormuz hopes ease Fed risks
- US Treasury yields fall as Hormuz progress pressures Oil prices.
- Weak NFP report pushes traders to trim Fed hike bets.
- Ten-year yield drops as markets price lower inflation risks.
US Treasury yields drop across the curve amid growing speculation that the Oman-Iran deal is about to be sealed, which has so far pushed energy prices lower, while investors also digest a “bad” Nonfarm Payrolls report in the US.
Yields slide across the curve as Oil declines, payrolls disappoint and traders price out September Fed tightening.
Recently, a US official said that there has been progress between Oman and Iran on Hormuz, and that once a deal is announced to restore shipping without impediments, the US Navy will lift the blockade of Iranian ports.
West Texas Intermediate (WTI); the US crude benchmark, extended its losses of nearly 1%, down to $77.50.
Meanwhile, money markets are indicating a lower likelihood that the Federal Reserve will hike rates in September. The probability has decreased to 30% from 58% yesterday, with a 70% chance that the Fed will keep rates steady, based on Prime Terminal data.
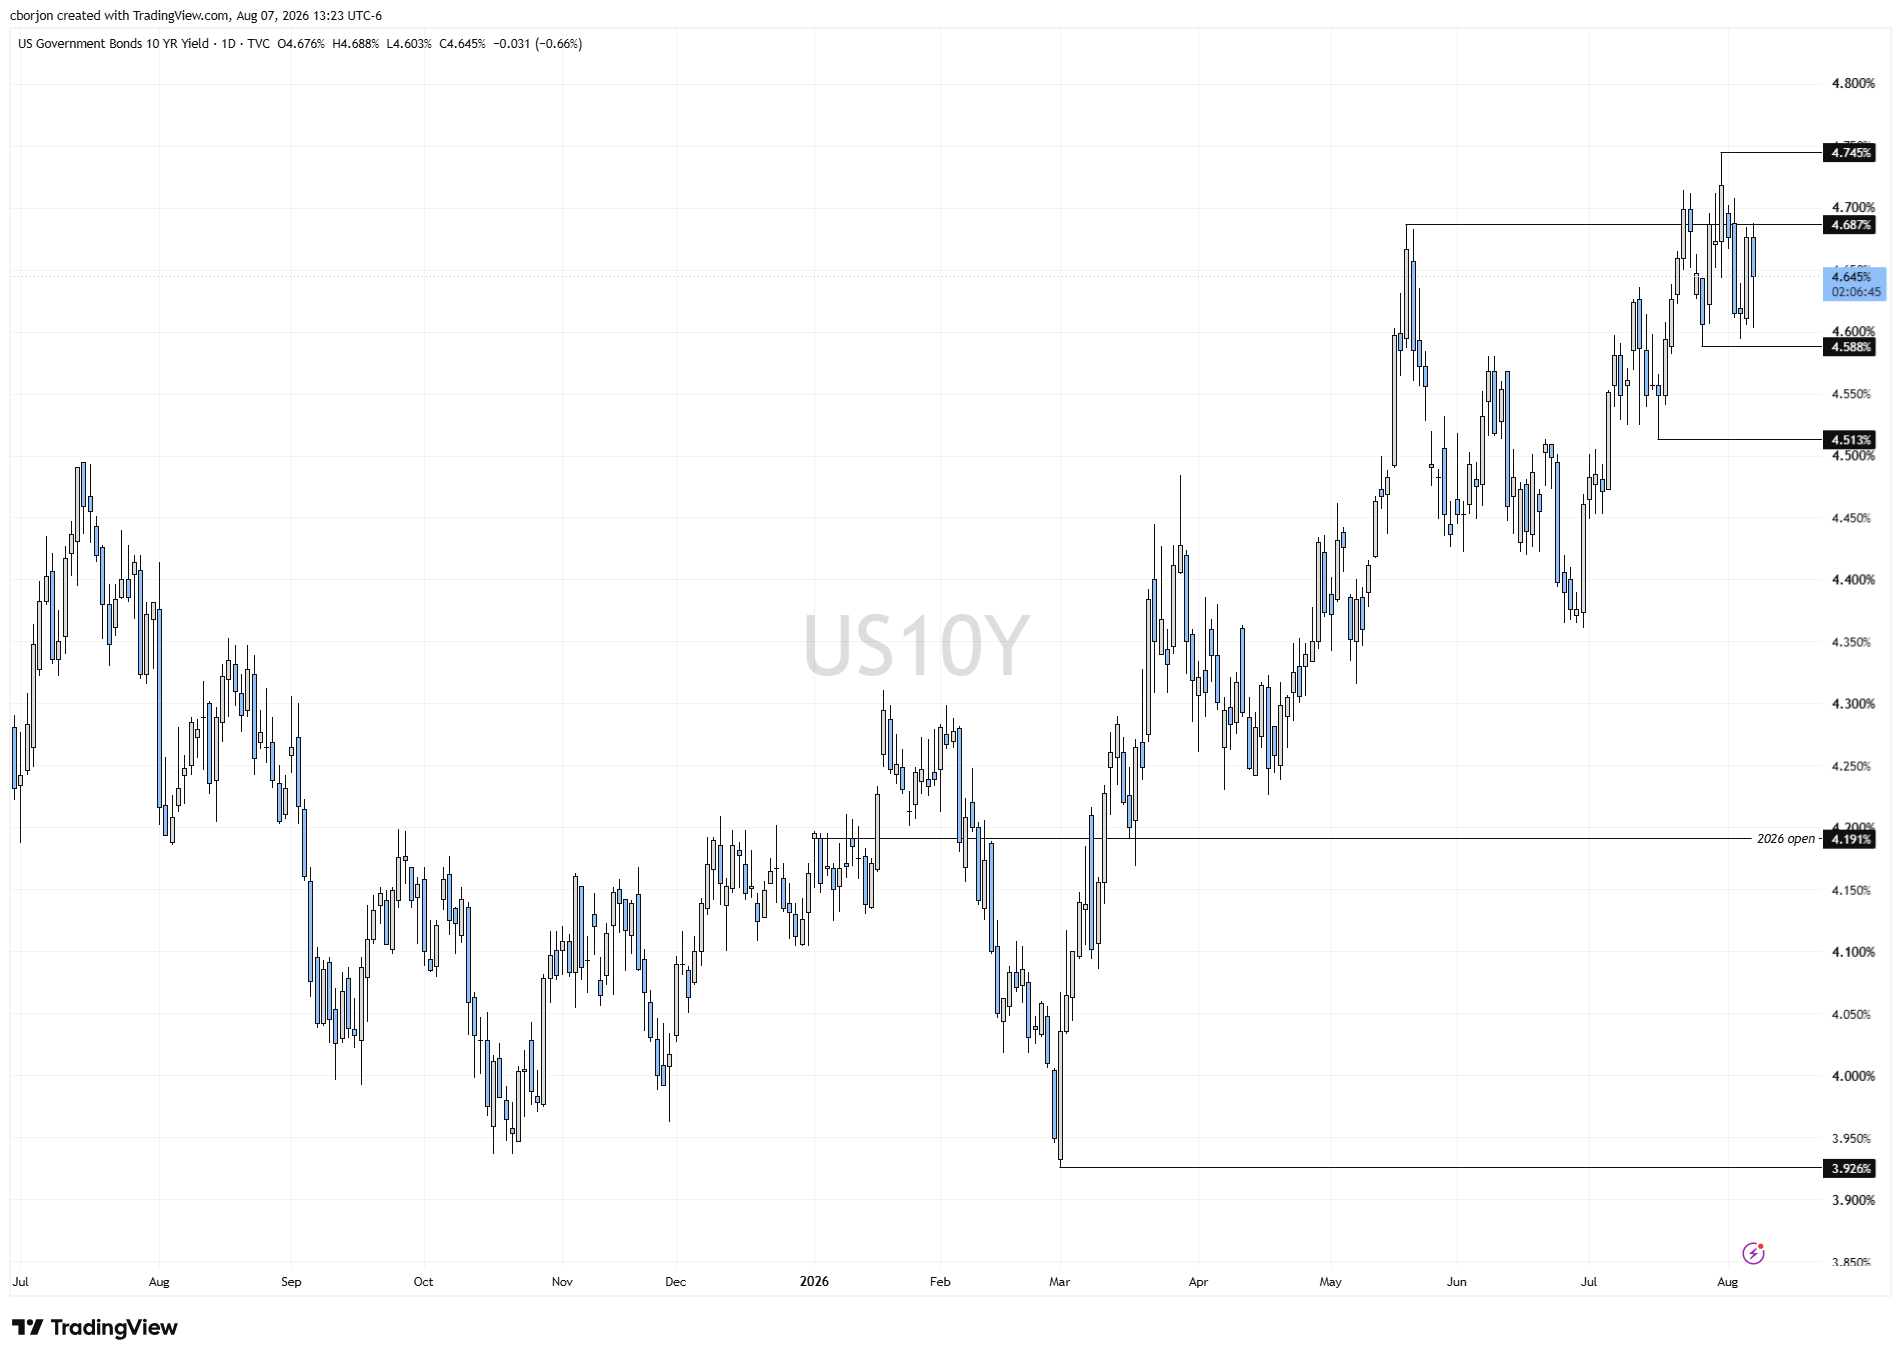
The US 10-year Treasury note is yielding 4.651%, down nearly 3 basis points, a signal that market participants have begun to price out a quick resolution to the US conflict, which could reduce the need for a rate hike by the Fed.
In July, US Nonfarm Payrolls declined by 23K jobs, falling short of the expected 80K increase. Revisions for May and June reduced the total by 103K jobs, lowering previous estimates. While this data backs the Fed’s decision to pause rate hikes, the Unemployment Rate decreased slightly from 4.2% to 4.1%.
The Greenback tumbled on the report, as the US Dollar Index (DXY), which measures the US Dollar's strength against six other currencies, fell 0.42% to 99.54.
Next week, investors are eyeing the release of US inflation on the consumer and producer side, followed by jobless claims data and the University of Michigan (UoM) Consumer Sentiment.
US 10-year Treasury yield chart
Interest rates FAQs
Interest rates are charged by financial institutions on loans to borrowers and are paid as interest to savers and depositors. They are influenced by base lending rates, which are set by central banks in response to changes in the economy. Central banks normally have a mandate to ensure price stability, which in most cases means targeting a core inflation rate of around 2%. If inflation falls below target the central bank may cut base lending rates, with a view to stimulating lending and boosting the economy. If inflation rises substantially above 2% it normally results in the central bank raising base lending rates in an attempt to lower inflation.
Higher interest rates generally help strengthen a country’s currency as they make it a more attractive place for global investors to park their money.
Higher interest rates overall weigh on the price of Gold because they increase the opportunity cost of holding Gold instead of investing in an interest-bearing asset or placing cash in the bank. If interest rates are high that usually pushes up the price of the US Dollar (USD), and since Gold is priced in Dollars, this has the effect of lowering the price of Gold.
The Fed funds rate is the overnight rate at which US banks lend to each other. It is the oft-quoted headline rate set by the Federal Reserve at its FOMC meetings. It is set as a range, for example 4.75%-5.00%, though the upper limit (in that case 5.00%) is the quoted figure. Market expectations for future Fed funds rate are tracked by the CME FedWatch tool, which shapes how many financial markets behave in anticipation of future Federal Reserve monetary policy decisions.
Recommended Articles


