


Ripple Price Forecast: XRP decline targets $1.00 support
- XRP extends its correction for the third consecutive day amid a dominantly weak technical structure.
- Very mild retail and institutional demand fails to lift XRP’s outlook, as headwinds weigh on price action.
- The Parabolic SAR is in line to provide support near $1.04 and prevent the sell-off from reaching $1.00.
Ripple (XRP) remains in a dominant bearish trend, trading at $10.08 as of Monday. This marks the third straight day the remittance token has extended its correction, with targets at the next key support levels of $0.04 and $1.00, respectively.
XRP attracts mild capital inflows
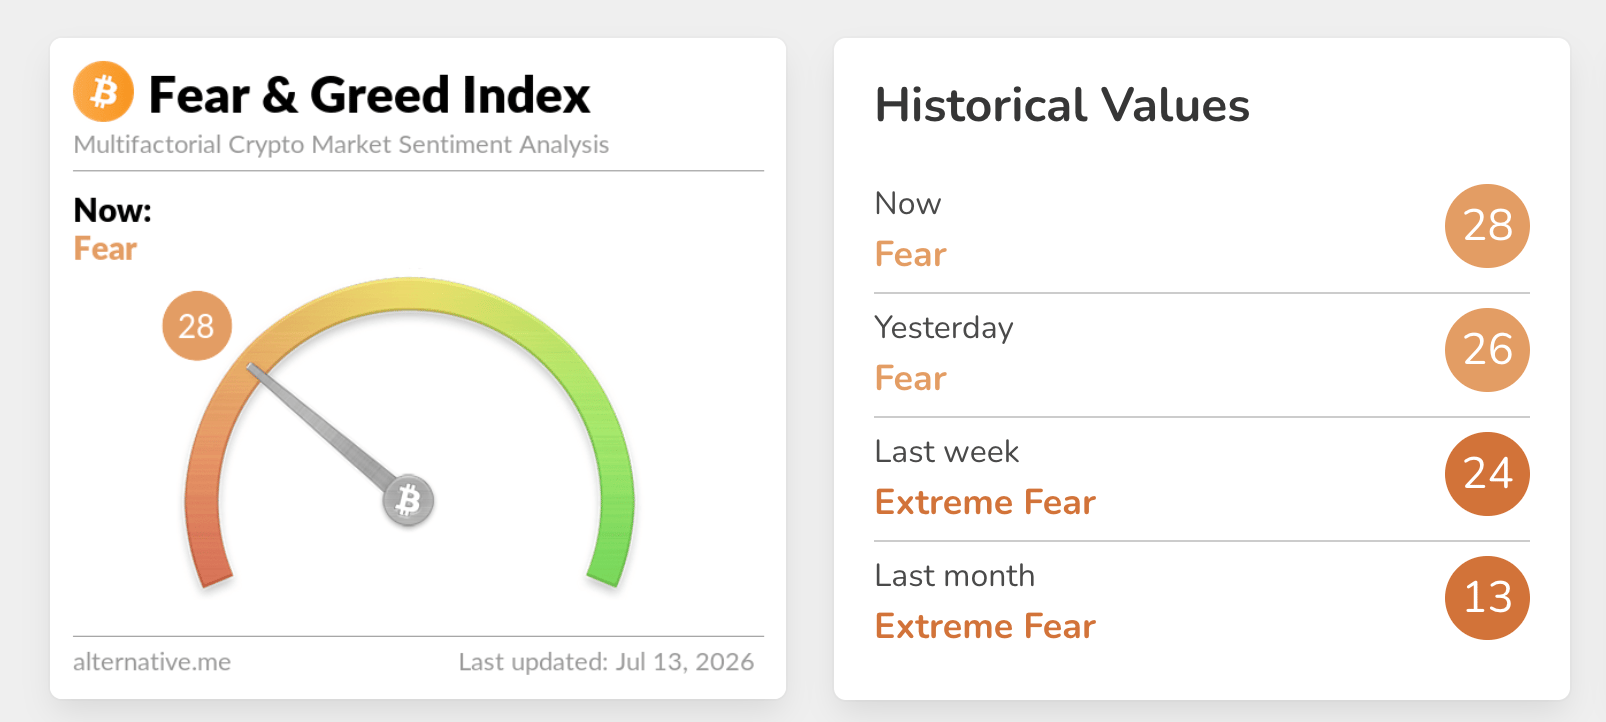
Appetite for XRP investment products has remained significantly suppressed despite marginal improvement in sentiment. According to the crypto Fear & Greed Index, sentiment analysis remains in Fear Territory at 28 on Monday, up slightly from 26 the previous day and 24 last week.
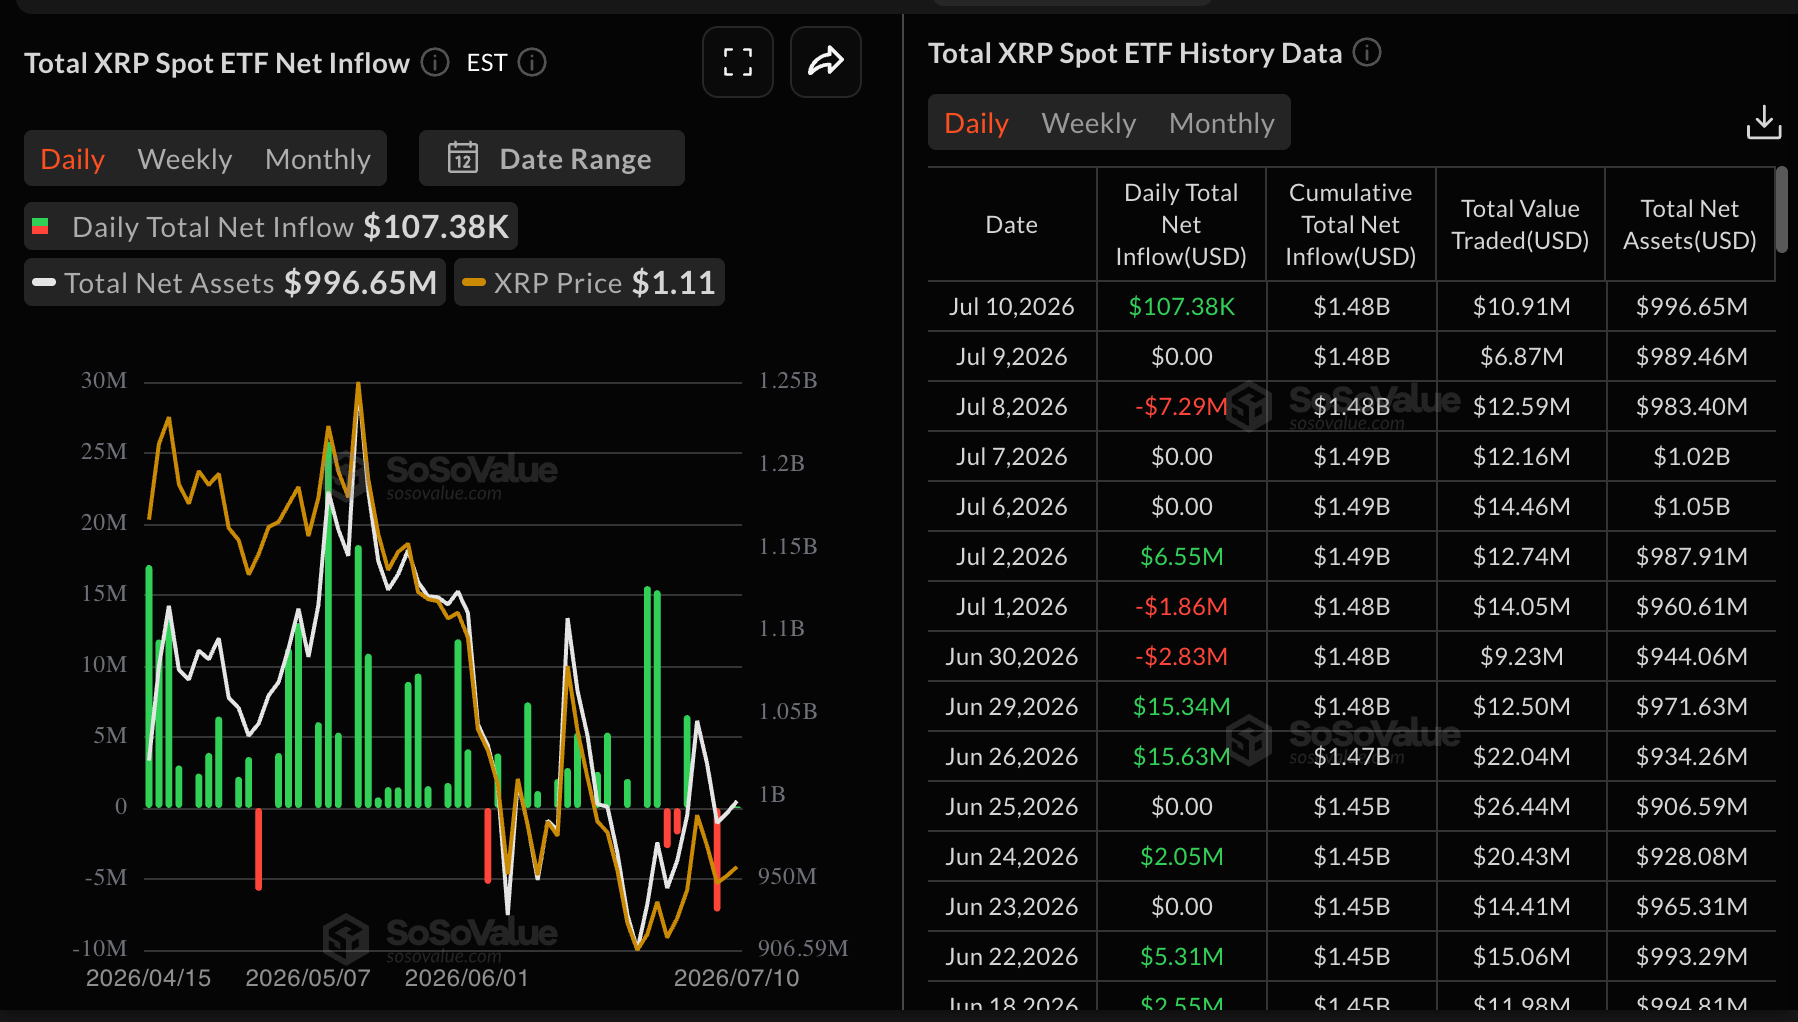
Inflows into XRP spot Exchange-Traded Funds (ETFs) returned on Friday, totaling $107,000 following muted activity on Thursday and roughly $7 million in outflows on Wednesday. SoSoValue data shows that cumulative inflows stand at $1.48 billion despite subdued demand. Sustained demand is needed to reinforce XRP’s recovery and lower the risk of dropping below $1.00.
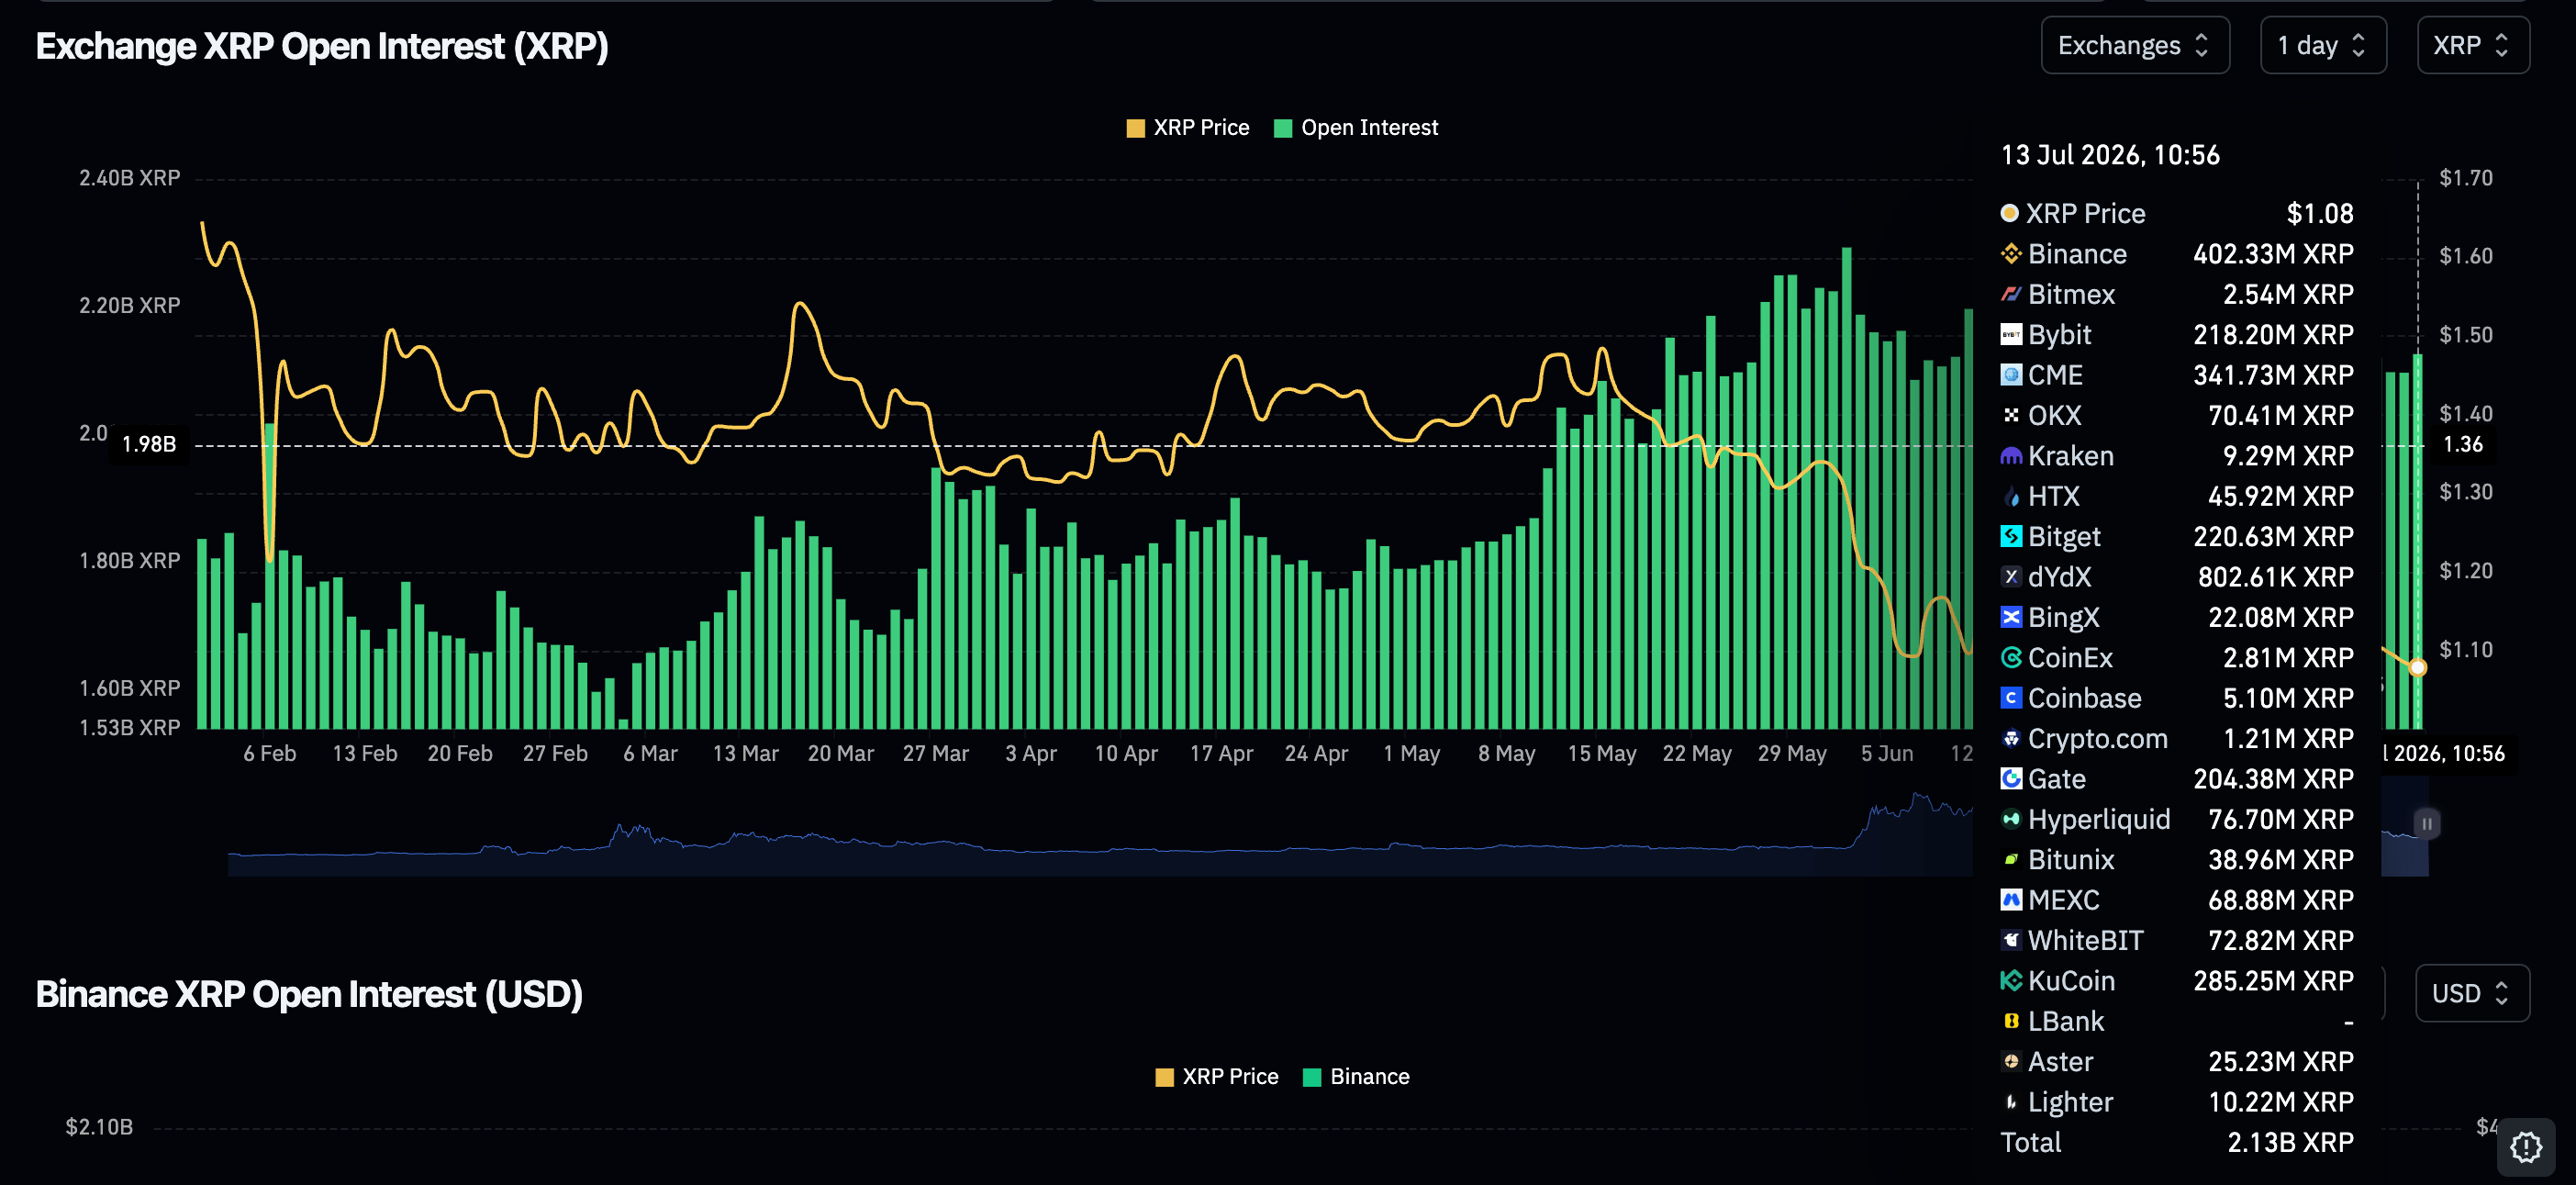
Retail demand is also on the back foot, even though perpetual futures Open Interest (OI) has increased to 2.13 billion XRP on Monday, from 2.10 billion XRP the previous day.
Nevertheless, an expanded scope shows a general narrowing of retail demand given that OI averaged 2.38 billion XRP on June 23. Hence, demand must hold steady over an extended period to affirm a strong bullish grip. Otherwise, XRP would remain at risk of dropping below the psychological $1.00 level.
"XRP, currently around $1.08, continues to consolidate following recent regulatory progress. The long-term outlook remains constructive as Ripple expands its payments infrastructure and cross-border use cases, but sustained upside will likely depend on broader improvements in market sentiment and stronger capital inflows into the altcoin market. Until then, range-bound trading is likely to continue," Ryan Lee, Chief Analyst at Bitget Research said in a comment sent to FXStreet.
Ripple once weighed handing XRP to shareholders
Ripple’s CEO Brad Garlinghouse opened up about the difficult moments that followed the lawsuit by the Securities and Exchange Commission (SEC) in 2020, saying that he and the co-founder Chris Larsen considered winding down the company and handing over XRP to shareholders.
Garlinghouse was speaking at the University of Kansas School of Business last week, where he intimated that it would have been the easier path, as opposed to a legal battle with a government he described as having “infinite power and resources.”
“I’m glad in retrospect, but that was not obvious at the time,” Garlinghouse said regarding the hundreds of jobs that would have been lost if they had gone ahead and handed the company to shareholders on a pro rata basis, dissolving it and ultimately ending the suit.
The SEC sued Ripple alleging that it had sold XRP as unregistered securities. Garlinghouse and Larsen were named as respondents in the lawsuit. However, Ripple was granted a second chance when Judge Analisa Torres ruled that XRP in itself was not a security. The SEC and Ripple settled the case in May 2025.
Technical outlook: XRP eyes lower levels
XRP retains a bearish near-term bias as price holds inside a downward parallel channel and below the key Exponential Moving Averages (EMAs). The 50-day EMA at $1.16, the 100-day EMA at $1.26 and the 200-day EMA near $1.47 all sit overhead, suggesting rallies remain corrective within a broader downtrend.
The Relative Strength Index (RSI) hovering around 42 hints at subdued momentum on the daily chart, reinforcing the idea that sellers still have the upper hand unless price can reclaim the overhead structure.
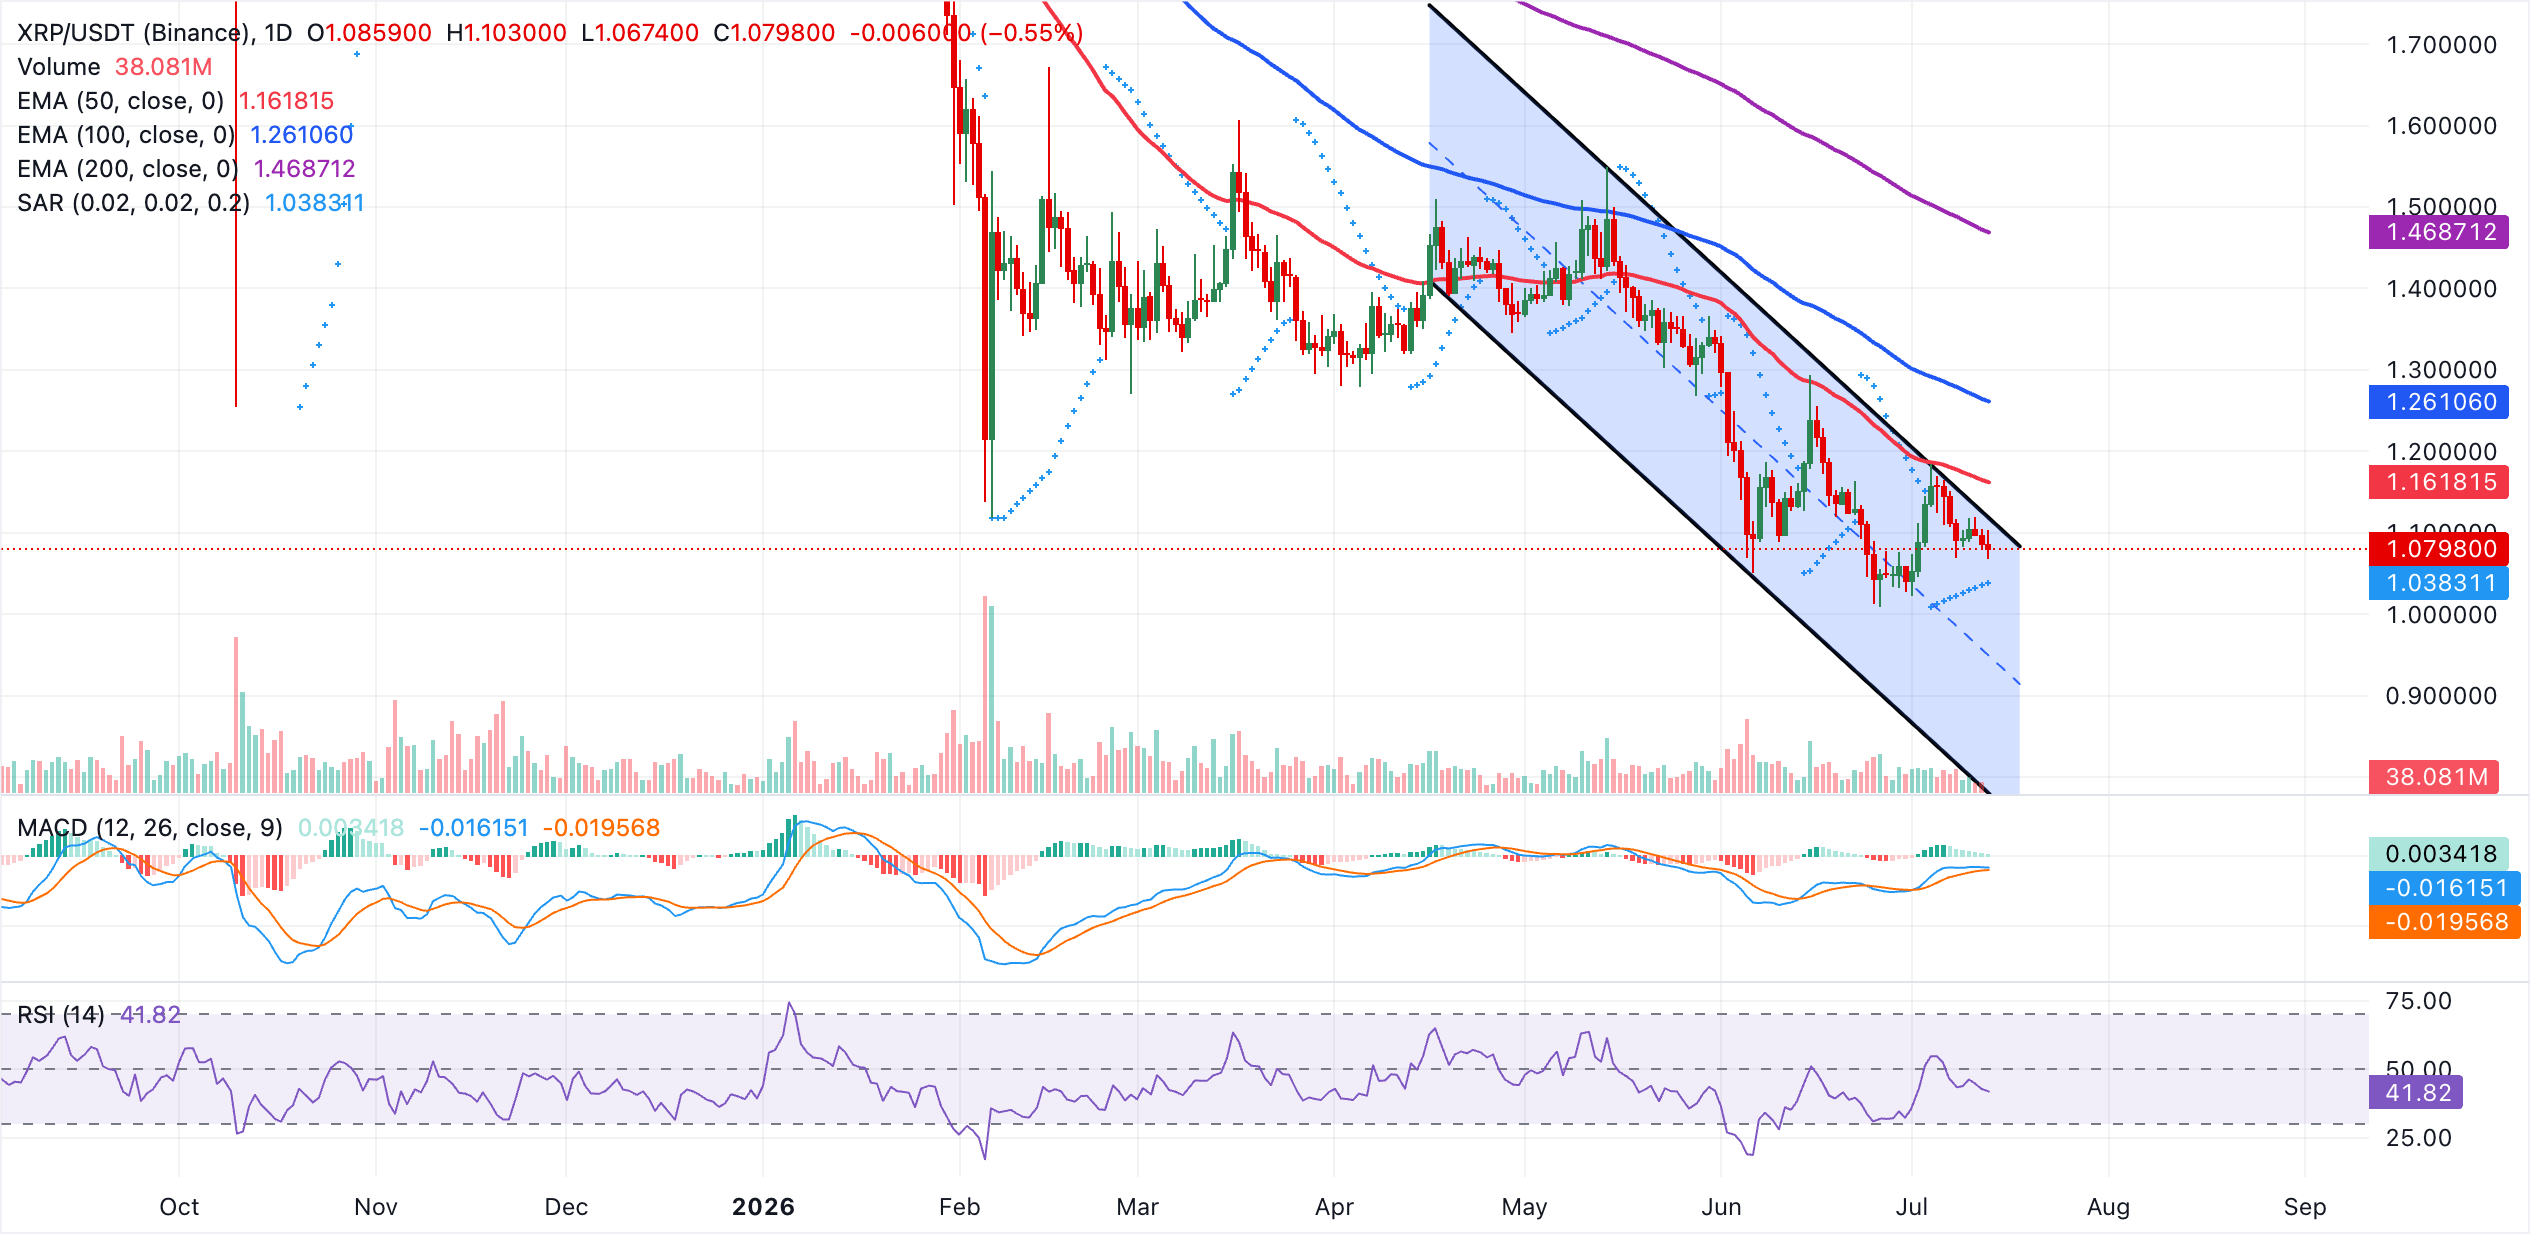
On the topside, initial resistance appears at the channel top around $1.12, with further barriers at the 50-day EMA near $1.16 and then the 100-day EMA at $1.26, before the longer-term 200-day EMA around $1.47 caps the broader recovery scope. Looking down, the Parabolic SAR support around $1.04 is the first level to watch. A sustained break below it would expose the lower boundary of the descending channel near $0.78, where buyers may again attempt to stabilize the pair.
(The technical analysis of this story was written with the help of an AI tool. Know more.)
Open Interest, funding rate FAQs
Higher Open Interest is associated with higher liquidity and new capital inflow to the market. This is considered the equivalent of increase in efficiency and the ongoing trend continues. When Open Interest decreases, it is considered a sign of liquidation in the market, investors are leaving and the overall demand for an asset is on a decline, fueling a bearish sentiment among investors.
Funding fees bridge the difference between spot prices and prices of futures contracts of an asset by increasing liquidation risks faced by traders. A consistently high and positive funding rate implies there is a bullish sentiment among market participants and there is an expectation of a price hike. A consistently negative funding rate for an asset implies a bearish sentiment, indicating that traders expect the cryptocurrency’s price to fall and a bearish trend reversal is likely to occur.
Recommended Articles


