


Cardano Price Forecast: ADA takes a breather near 200-day EMA, upside bias remains intact
- Cardano price trades slightly lower on Monday after surging by more than 13% the previous week.
- On-chain data flashes neutral signals, while derivatives data points to mild bullish sentiment among traders.
- The technical outlook remains constructive, with a sustained hold above key support levels potentially hinting at further gains.
Cardano (ADA) price edges lower to $0.27 on Monday, after rallying over 13% the previous week. Despite the short-term pause, derivatives data shows mild bullish positioning among traders. On the technical side, price action remains constructive, suggesting the upward move could extend if key support levels remain intact.
On-chain remains neutral while derivatives show a mild bullish bias
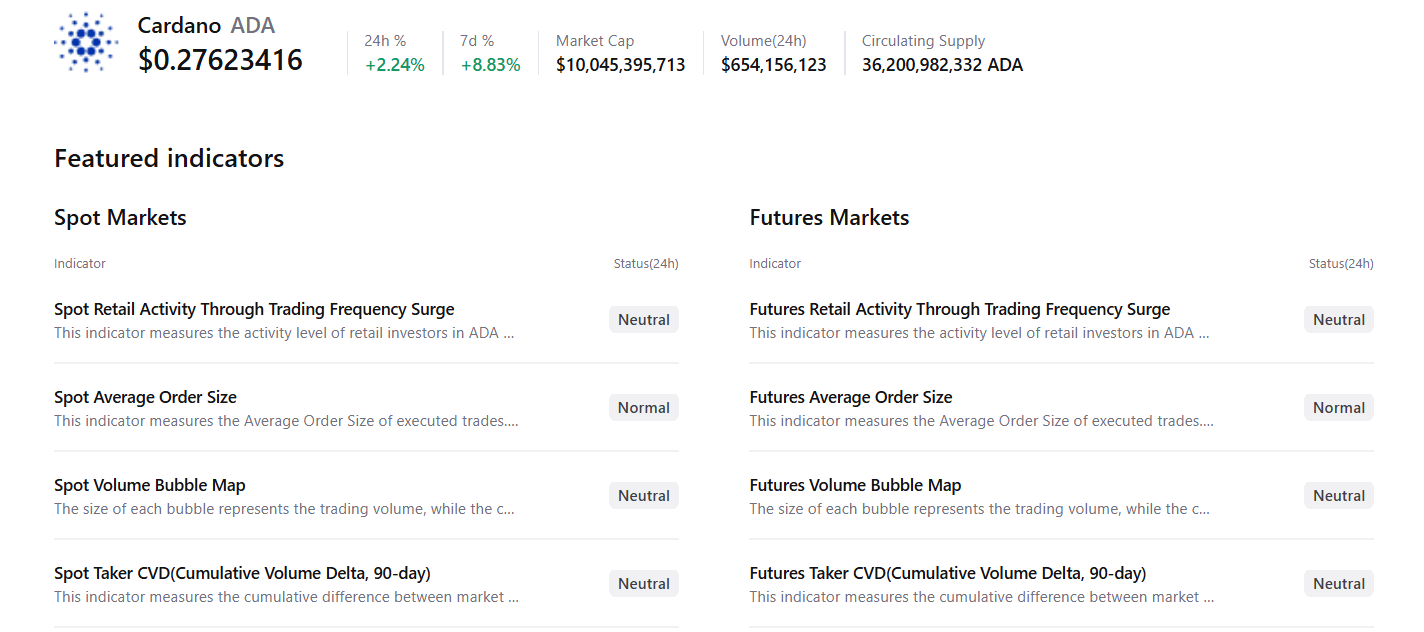
CryptoQuant summary data suggests a broadly neutral outlook for Cardano, with most metrics showing subdued activity and little directional conviction among market participants, as shown below.
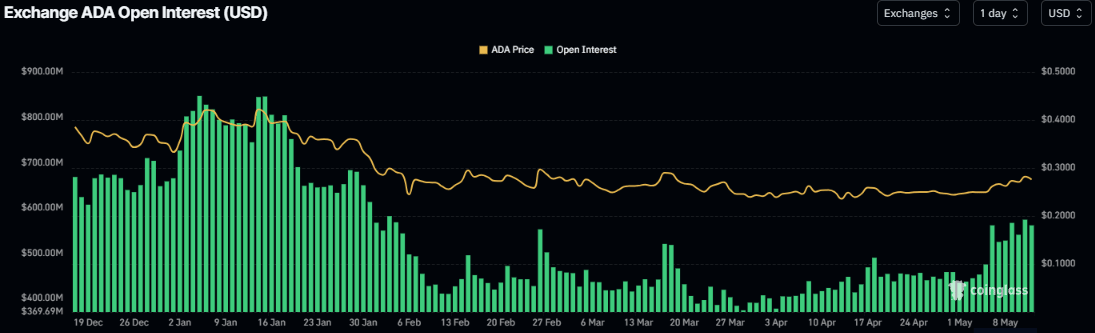
On the derivatives side, a mild bullish outlook emerges among Cardano traders. CoinGlass data shows that futures’ Open Interest (OI) at exchanges in ADA surges to $561.13 million on Monday from $450 million on May 4 and has been rising steadily since mid-April. An increasing OI indicates new or additional money entering the market and new buying, which could fuel a rally in Cardano price.
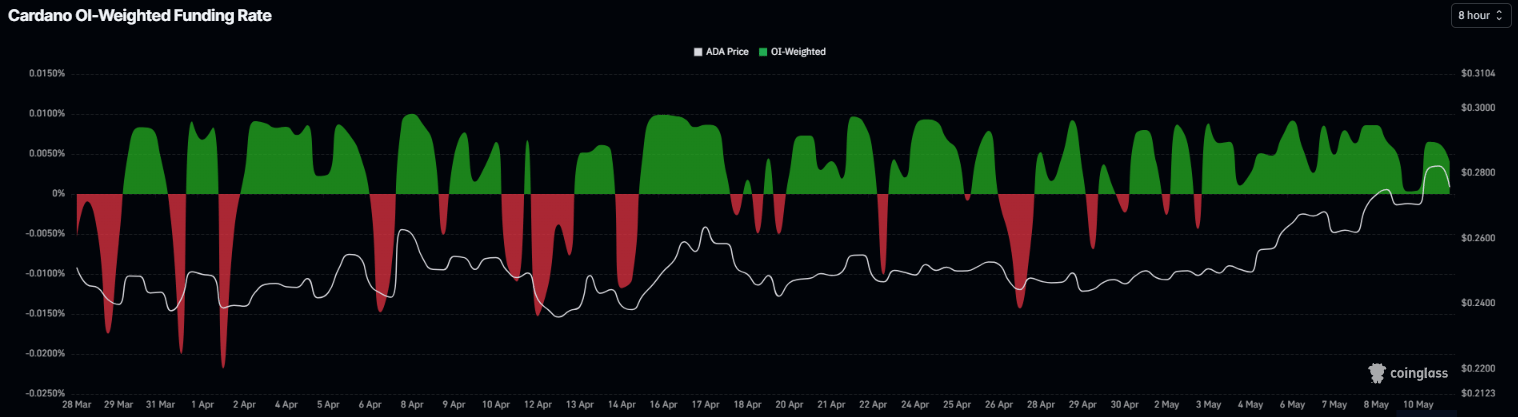
In addition, Cardano’s funding rates flipped positive on May 4 and surge to 0.0040% on Monday, indicating that longs are paying shorts. Historically, as shown in the chart below, when the funding rates have flipped from negative to positive and risen, the ADA price has rallied sharply.
Cardano Price Forecast: Gains pause near key resistance
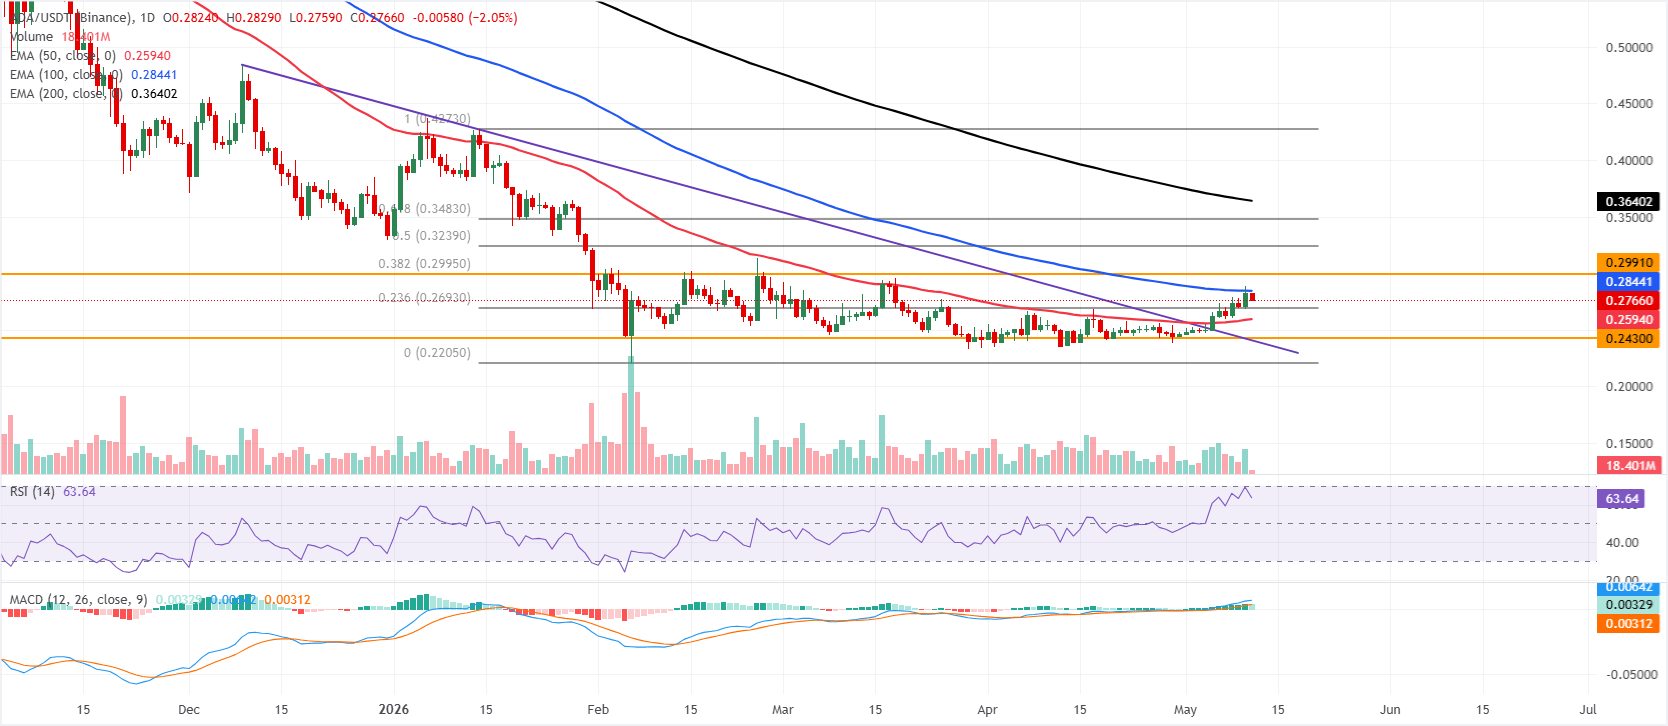
Cardano price is trading at $0.27 on Monday and holds a constructive near-term bias as it continues to trade above the 50-day Exponential Moving Average (EMA) at $0.25 and the 23.6% Fibonacci retracement at $0.26.
The Relative Strength Index (RSI) on the daily chart around 64 tilts bullish but shy of overbought territory, while the Moving Average Convergence Divergence (MACD) histogram remains positive, together suggesting buyers retain control despite notable overhead supply from higher moving averages and Fibonacci levels.
On the topside, initial resistance emerges at the 100-day EMA near $0.28, with a more significant cap at the horizontal barrier around $0.30 that aligns closely with the 38.2% Fibonacci retracement; a sustained break above this confluence would expose the 50% retracement at $0.32 and the 61.8% level at $0.35, ahead of the 200-day EMA near $0.36 and higher Fibonacci resistance toward $0.38 and the broader downtrend line.
On the downside, immediate support is seen at the 23.6% retracement around $0.26, followed by the 50-day EMA at $0.26; a deeper pullback would bring the horizontal floor at $0.24 into view, with the prior swing low near $0.22 acting as a more distant line of defense.
(The technical analysis of this story was written with the help of an AI tool.)
Recommended Articles


