


British Pound clings to gains against US Dollar, US CPI in focus
- The British Pound trades firmly at around 1.3500 against the US Dollar.
- Investors await the US CPI data for July and the UK Q2 GDP data.
- The Fed is not expected to raise interest rates in September anymore.
The British Pound (GBP) holds onto two-day gains marginally at around 1.3500 against the US Dollar (USD) during the Asian trading session on Tuesday. The GBP/USD pair remains firm as the British Pound outperforms despite financial markets pricing out the possibility of an interest rate hike by the Bank of England (BoE) in the near term.
Pound Sterling Price This week
The table below shows the percentage change of British Pound (GBP) against listed major currencies this week. British Pound was the strongest against the Japanese Yen.
| USD | EUR | GBP | JPY | CAD | AUD | NZD | CHF | |
|---|---|---|---|---|---|---|---|---|
| USD | 0.08% | -0.18% | 0.89% | -0.14% | 0.08% | 0.12% | 0.29% | |
| EUR | -0.08% | -0.27% | 0.79% | -0.29% | -0.06% | -0.06% | 0.11% | |
| GBP | 0.18% | 0.27% | 1.01% | -0.03% | 0.21% | 0.23% | 0.36% | |
| JPY | -0.89% | -0.79% | -1.01% | -0.71% | -0.47% | -0.59% | -0.39% | |
| CAD | 0.14% | 0.29% | 0.03% | 0.71% | 0.25% | 0.12% | 0.47% | |
| AUD | -0.08% | 0.06% | -0.21% | 0.47% | -0.25% | 0.00% | 0.14% | |
| NZD | -0.12% | 0.06% | -0.23% | 0.59% | -0.12% | -0.00% | 0.15% | |
| CHF | -0.29% | -0.11% | -0.36% | 0.39% | -0.47% | -0.14% | -0.15% |
The heat map shows percentage changes of major currencies against each other. The base currency is picked from the left column, while the quote currency is picked from the top row. For example, if you pick the British Pound from the left column and move along the horizontal line to the US Dollar, the percentage change displayed in the box will represent GBP (base)/USD (quote).
Strategists at Rabobank point out that “for the UK, the market is currently pricing in a reduced expectation of a rate hike by the end of the year,
This week, the major trigger for the British currency will be the preliminary United Kingdom (UK) Q2 and the June month Gross Domestic Product (GDP) data, which will be released on Thursday. In the April-June period, the UK economy is expected to have grown at a moderate pace of 0.4% vs. the previous reading of 0.6%. On a monthly basis, the GDP is seen contracting by 0.1%.
Meanwhile, the US Dollar Index (DXY) trades almost flat at press time, holding onto Monday’s recovery move at around 99.80. The USD Index is expected to remain sideways as investors await the United States (US) Consumer Price Index (CPI) data for July, which will be released on Wednesday.
US inflation seen firming but not reaccelerating in July
Brown Brothers Harriman’s Elias Haddad expects the upcoming US July CPI report to show inflation "firm modestly but stop short of signaling a renewed acceleration in inflation." He notes that "headline CPI is expected to rise +0.1% m/m vs. -0.4% in June and ease to 3.4% y/y vs. 3.5% in June," while "core CPI is expected to rise +0.2% m/m vs. 0.0% in June and ease to 2.5% y/y vs. 2.6% in June." The data are due Wednesday and, in Haddad’s view, should confirm a gradual cooling in underlying price pressures rather than a renewed upswing.
The US inflation data will have a significant impact on the Federal Reserve's (Fed) interest rate expectations, as the July monetary policy statement showed heightened concerns among policymakers toward upside inflation risks.
Lately, traders have priced out the possibility of a Fed interest rate hike in the September meeting after the release of weak US Nonfarm Payrolls (NFP) data for July.
GBP/USD Technical Analysis
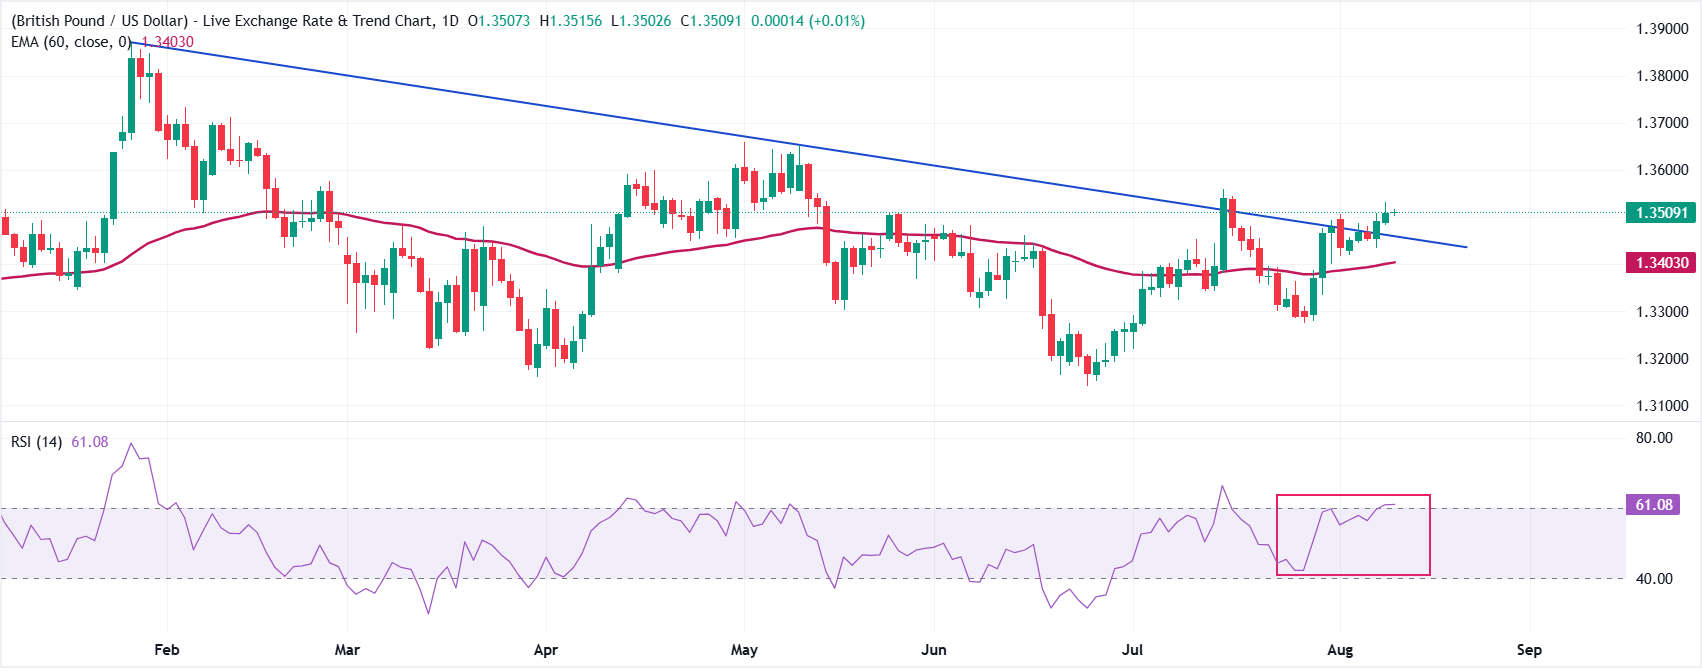
In the daily chart, GBP/USD trades at 1.3500, retaining a bullish near-term tone as spot holds above the 60-day exponential moving average (EMA) at 1.3403 and the broken downward resistance trend line now offering support around 1.3456. The Relative Strength Index (14) at 61.1 leans into positive territory, suggesting buyers remain in control while momentum is not yet stretched into overbought conditions.
On the downside, immediate support emerges at the former trend-line cap turned floor near 1.3456, followed by the 60-day EMA at 1.3403, where a deeper pullback would be expected to attract fresh demand. As long as GBP/USD defends these layers of underlying support, the pair would likely continue to favor the topside, with bulls eyeing further gains above the recent 1.3509 close in the sessions ahead.
(The technical analysis of this story was written with the help of an AI tool. Know more.)
Economic Indicator
Consumer Price Index (YoY)
Inflationary or deflationary tendencies are measured by periodically summing the prices of a basket of representative goods and services and presenting the data as The Consumer Price Index (CPI). CPI data is compiled on a monthly basis and released by the US Department of Labor Statistics. The YoY reading compares the prices of goods in the reference month to the same month a year earlier.The CPI is a key indicator to measure inflation and changes in purchasing trends. Generally speaking, a high reading is seen as bullish for the US Dollar (USD), while a low reading is seen as bearish.
Read more.Next release: Wed Aug 12, 2026 12:30
Frequency: Monthly
Consensus: 3.4%
Previous: 3.5%
Source: US Bureau of Labor Statistics
The US Federal Reserve (Fed) has a dual mandate of maintaining price stability and maximum employment. According to such mandate, inflation should be at around 2% YoY and has become the weakest pillar of the central bank’s directive ever since the world suffered a pandemic, which extends to these days. Price pressures keep rising amid supply-chain issues and bottlenecks, with the Consumer Price Index (CPI) hanging at multi-decade highs. The Fed has already taken measures to tame inflation and is expected to maintain an aggressive stance in the foreseeable future.
Recommended Articles


