


US Dollar Index: Trades firmly near 100.35 ahead of Fed speeches
- The US Dollar trades strongly at the start of the week.
- The Fed is almost certain to deliver at least one more interest rate hike this year.
- Investors await Fed speeches and the outcome of meeting between leaders from the US and Gulf nations.
The US Dollar (USD) reflects strength at the start of the week on prospects of further Federal Reserve (Fed) monetary tightening this year. At press time, the US Dollar Index (DXY), which gauges the Greenback’s value against six major currencies, is up 0.15% to near 100.37.
US Dollar Price Today
The table below shows the percentage change of US Dollar (USD) against listed major currencies today. US Dollar was the strongest against the Japanese Yen.
| USD | EUR | GBP | JPY | CAD | AUD | NZD | CHF | |
|---|---|---|---|---|---|---|---|---|
| USD | 0.03% | 0.12% | 0.22% | 0.22% | -0.04% | 0.07% | 0.13% | |
| EUR | -0.03% | 0.02% | 0.13% | 0.12% | -0.12% | -0.04% | 0.05% | |
| GBP | -0.12% | -0.02% | 0.11% | 0.10% | -0.13% | -0.08% | 0.04% | |
| JPY | -0.22% | -0.13% | -0.11% | 0.00% | -0.28% | -0.13% | -0.04% | |
| CAD | -0.22% | -0.12% | -0.10% | -0.01% | -0.29% | -0.16% | -0.06% | |
| AUD | 0.04% | 0.12% | 0.13% | 0.28% | 0.29% | 0.11% | 0.20% | |
| NZD | -0.07% | 0.04% | 0.08% | 0.13% | 0.16% | -0.11% | 0.09% | |
| CHF | -0.13% | -0.05% | -0.04% | 0.04% | 0.06% | -0.20% | -0.09% |
The heat map shows percentage changes of major currencies against each other. The base currency is picked from the left column, while the quote currency is picked from the top row. For example, if you pick the US Dollar from the left column and move along the horizontal line to the Japanese Yen, the percentage change displayed in the box will represent USD (base)/JPY (quote).
According to the CME FedWatch tool, the odds of the Fed delivering at least one more interest rate hike this year are almost 88%.
Hawkish Fed bets have increased after the policy announcement last week, in which it raised interest rates by 25 basis points (bps) to 3.75%-4.00% and signaled at least one more this year.
Meanwhile, investors await speeches from Federal Reserve (Fed) members amid the completion of the blackout period. Later in the day, Chicago Fed Bank President Austan Goolsbee is scheduled to speak in London at an Official Monetary and Financial Institutions Forum event.
Over the weekend, Minneapolis Fed Bank President Neel Kashkari said in an interview with Fox News' Sunday Morning Futures, that high inflation remains a key concern for policymakers and is not just in rising oil prices.
Kashkari keeps hawkish bias as resilient US economy sustains inflation risks
Kashkari’s latest remarks score 6.2 on the FXS Speechtracker, essentially in line with the 6.3 historical average and signaling a steady hawkish tone. Emphasis that inflation “remains too high,” extends beyond oil, and must be addressed alongside robust growth, resilient activity, and improving productivity underscores a message that policy cannot relax yet even as the real economy shows strength. The reminder that the bond market is the Treasury’s responsibility, coupled with a still-robust labor market, keeps the focus on persistent underlying price pressures rather than market volatility.
The FXS Fed Sentiment Index fell by 1.47 points to 150.61, indicating a modest pullback in perceived hawkishness while remaining firmly above the neutral 100 mark. This configuration suggests that, despite a slight softening in tone, the Fed narrative tracked by the FXS Speechtracker is still clearly hawkish, consistent with a central bank that sees resilient growth and sticky inflation as reasons to keep policy restrictive.
On the global front, investors await meeting between US President Donald Trump and leaders from Gulf nations at the United Nations (UN) General Assembly in New York beginning today (Monday, 21 September).
US Dollar Index Technical Analysis
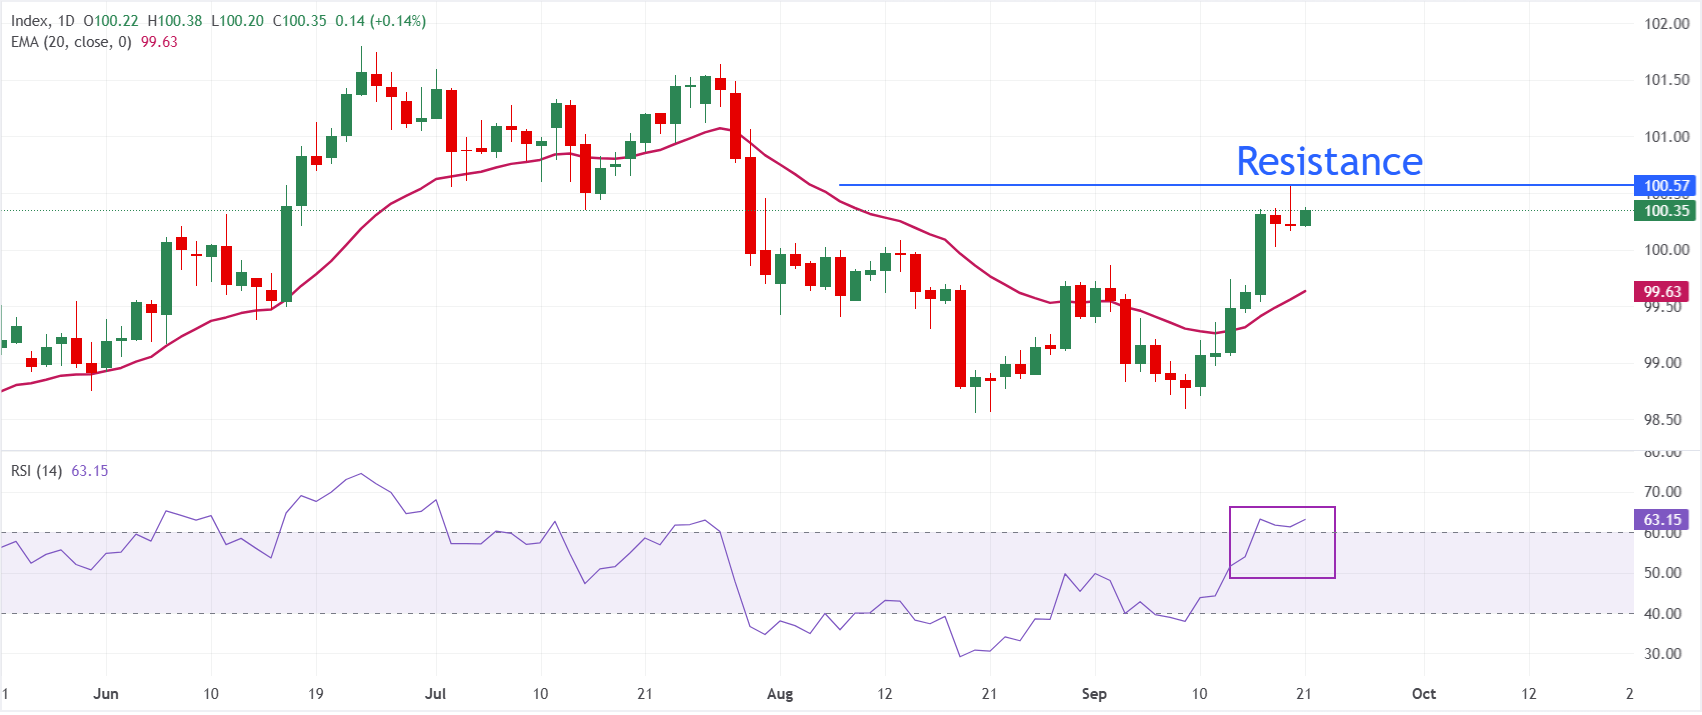
In the daily chart, Dollar Index Spot trades at 100.35. The near-term bias is bullish as price has pushed decisively above the 20-day exponential moving average (EMA) at 99.63, indicating that recent gains have tilted the short-term trend higher.
The Relative Strength Index (RSI) at 63.15 sits in positive territory, suggesting building upside momentum without yet signaling overbought conditions.
On the topside, the immediate focus is whether the index can maintain its break above the 20-day EMA at 99.63, which now acts as a nearby dynamic reference for the bulls. Holding above this moving average would keep the constructive tone intact and leave room for further appreciation above the last week high near 100.55, while a daily close back below it would hint at a loss of upside traction and a possible pause in the current advance.
(The technical analysis of this story was written with the help of an AI tool. Know more.)
Economic Indicator
Interest Rate Projections - 1st year
At four of its eight scheduled meetings, the Federal Reserve (Fed) releases a Summary of Economic Projections, or ‘dot-plot’. This shows each member of the Federal Open Market Committee’s (FOMC) forecast for where they expect the federal funds rate (the interest rate at which banks lend to each other) will go in the future. It can have a major impact on the US Dollar (USD), particularly if members change their forecasts. It is widely used as a guide to figure out the terminal rate and the possible timing of a policy pivot.
Read more.Last release: Wed Sep 16, 2026 18:00
Frequency: Irregular
Actual: 4.1%
Consensus: -
Previous: 3.6%
Source: Federal Reserve
Recommended Articles


