

Quant Price Forecast: 50-day EMA rebound brings September’s 370% rally back in focus

Source Fxstreet
  • Quant hovers around $189 on Monday, holding above its 50-day EMA around $171 with a 6% rebound the previous day.
  • QNT derivatives hold firm retail demand, with Open Interest stabilizing above $90 million.
  • Quant’s technical outlook loses its near-term bearishness, as pullback momentum eases to neutral with the 50-day EMA at $171 in focus.

Quant (QNT) trades around $189 on Monday, sustaining its 6% rebound from the previous day as the bulls attempt to extend September’s rally. QNT Open Interest hovers above $90 million, reflecting firm retail demand in the Decentralized Finance (DeFi) token. The technical outlook highlights a potential rebound from the 50-day Exponential Moving Average (EMA) around $171, amid weakening downside momentum.

Retail demand in QNT holds firm

Quant holds firm retail strength in the leverage market. CoinGlass data shows QNT Open Interest (OI) at $92.98 million, up from $87.90 million the previous day, indicating a stabilization of its pullback from $192.16 million on October 5. This stabilization of the declining notional value of active contracts suggests that the decline in the spot price and the positional wipeout have eased, implying bullish anticipation among traders.
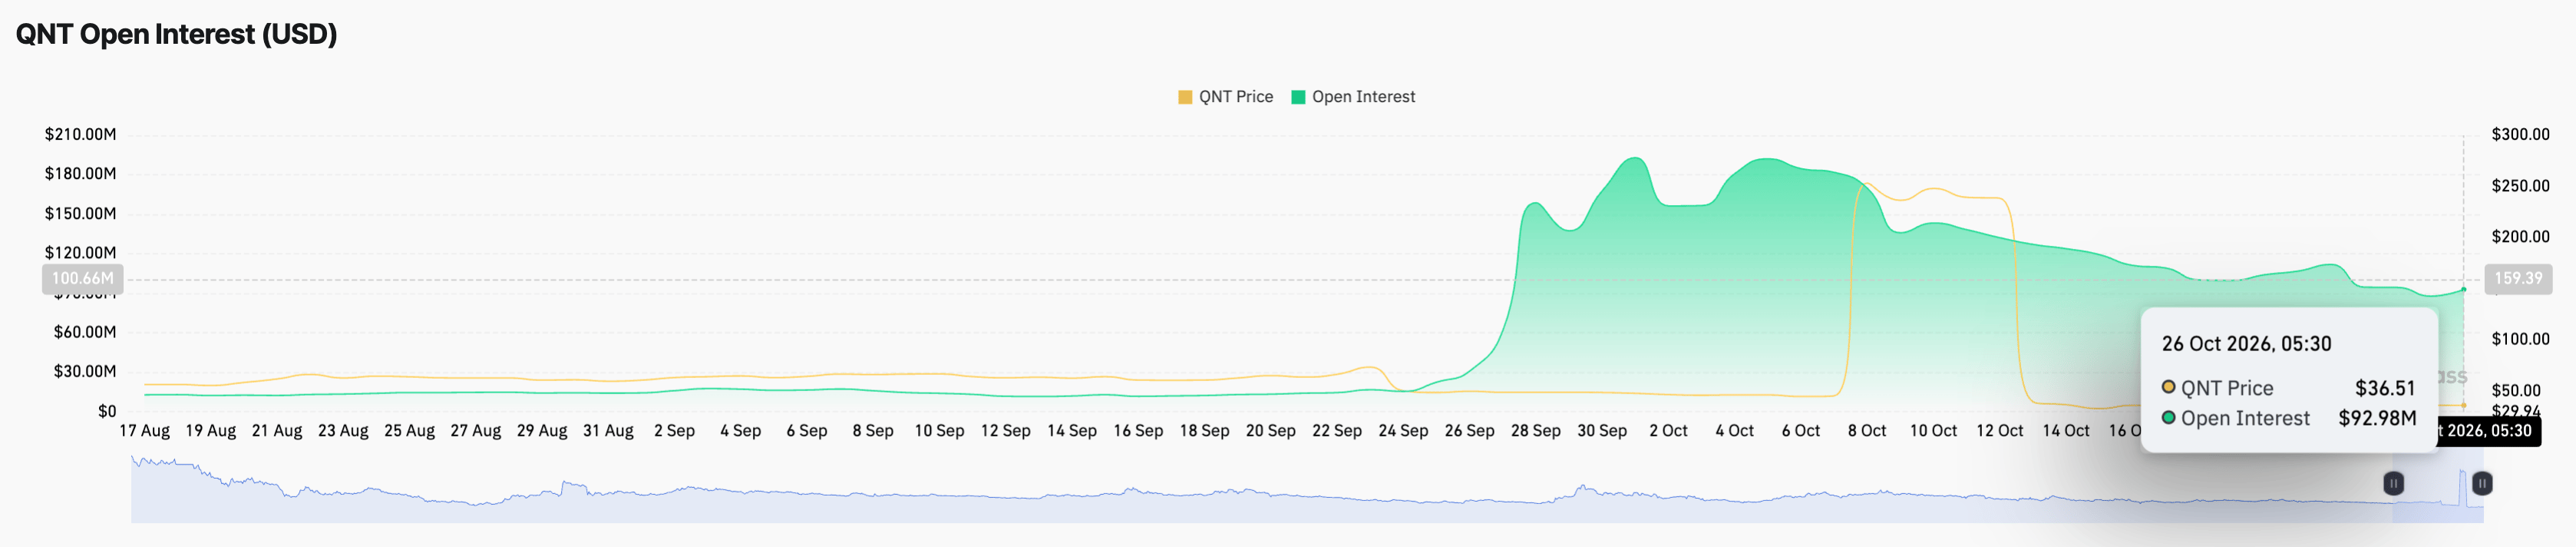
QNT derivatives data. Source: CoinGlass

Technical outlook: Will QNT price reclaim $200?

QNT trades at $189 at press time on Monday, holding a constructive bullish bias following the 370% rally in September. QNT price shows signs of stability near the 50-day EMA at $171, which sits well above the 200-day EMA at $109, reaffirming a long-term constructive tone.

The recovery from the 50-day EMA aligns with the 50% retracement, measured from $60 to $373, at $150, which now underpins the advance. A confirmed breakout above last week's high of $212 could renew the upward trend, paving the way toward the $373 peak.

The Moving Average Convergence Divergence (MACD) line is marginally below its signal line, hinting at a gradual sideways shift as the negative histogram profile contracts, while the Relative Strength Index (RSI) sits just below the neutral 50 mark. Taken together, the indicators suggest a consolidation phase rather than aggressive selling.

Chart Analysis QNT/USDT (Binance)
QNT/USDT daily price chart.

On the downside, immediate support is seen at the 50-day EMA at $171, reinforced by the 50% retracement at $150.

(The technical analysis of this story was written with the help of an AI tool. Know more.)

Disclaimer: For information purposes only. Past performance is not indicative of future results.
placeholder
Markets on a Wire: Imminent US Inflation Data Threatens to Lock In Fed Rate Hikes Imminent CPI and PPI data threaten to lock in a hawkish Federal Reserve rate hike cycle, leaving gold, tech equities, and Bitcoin highly vulnerable to a programmatic sell-off.
Author  Mitrade Team
Jun 09, Tue
Imminent CPI and PPI data threaten to lock in a hawkish Federal Reserve rate hike cycle, leaving gold, tech equities, and Bitcoin highly vulnerable to a programmatic sell-off.
placeholder
XAUUSD Gold Analysis: Gold Holds Above $4,350 Ahead of US Inflation Data Is $4,500 Next? Gold holds above $4,350 following weak US jobs data. As inflation reports approach and UBS eyes $5,000, can XAUUSD break resistance at $4,435 to rally toward $4,500?
Author  Naoufal Seddik
Aug 12, Wed
Gold holds above $4,350 following weak US jobs data. As inflation reports approach and UBS eyes $5,000, can XAUUSD break resistance at $4,435 to rally toward $4,500?
placeholder
Gold Price Analysis Today: Gold Drops 1.32% Despite Lower Fed Rate-Hike Bets, Can $4,313 Support Hold? Gold fell 1.32% on August 13 after rising to $4,449.73, then reversing lower and closing near $4,349.918 below the $4,356.46 support. Softer US inflation data reduced Fed rate hike expectations, but selling pressure still dominated the session. Will $4,313 support hold?
Author  Naoufal Seddik
Aug 14, Fri
Gold fell 1.32% on August 13 after rising to $4,449.73, then reversing lower and closing near $4,349.918 below the $4,356.46 support. Softer US inflation data reduced Fed rate hike expectations, but selling pressure still dominated the session. Will $4,313 support hold?
placeholder
Gold Price Analysis Today: Gold Gains 0.94% as Markets Expect Fed to Hold Rates, Can $4,449 Resistance Break? Gold gained 0.94% on August 17, closing near $4,417.30 as softer US data strengthened expectations for unchanged Fed rates in September. Gold remains bullish, with $4,449.730 resistance and $4,310.650 support in focus.
Author  Naoufal Seddik
Aug 18, Tue
Gold gained 0.94% on August 17, closing near $4,417.30 as softer US data strengthened expectations for unchanged Fed rates in September. Gold remains bullish, with $4,449.730 resistance and $4,310.650 support in focus.
placeholder
3 Stocks That Can Benefit From SpaceX’s Surprise Q3 EarningsSpaceX’s latest earnings have given Wall Street a reason to revisit AI hardware stocks. Elon Musk’s company is preparing to spend billions more on computing infrastructure, and three US-listed stocks
Author  Beincrypto
Oct 21, Wed
SpaceX’s latest earnings have given Wall Street a reason to revisit AI hardware stocks. Elon Musk’s company is preparing to spend billions more on computing infrastructure, and three US-listed stocks
goTop
quote